The cohort effect when crime and incarceration were rising
Coates (2015) presented a graph showing that the USA violent crime rate surged after 1960, but the incarceration rate didn’t start rising until after 1970. Based on this time lag, Coates concluded that incarceration “rose independent of crime”. Hymowitz (2015) responded that this lag was better explained by policy that was “slow to catch up in the 1960s as crime was on the rise”.
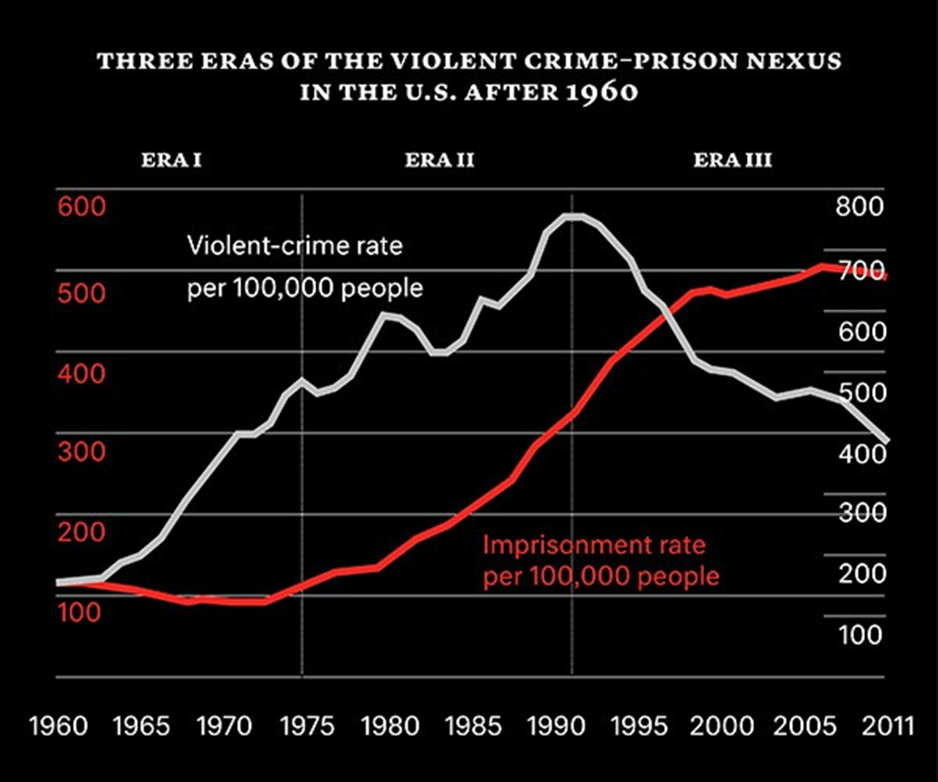
Coates and Hymowitz were both wrong. The time lag between the rise in violent crime and the rise in incarceration is explained by birth year trends in lead exposure, and by another factor that neither Coates nor Hymowitz considered: the war in Vietnam.
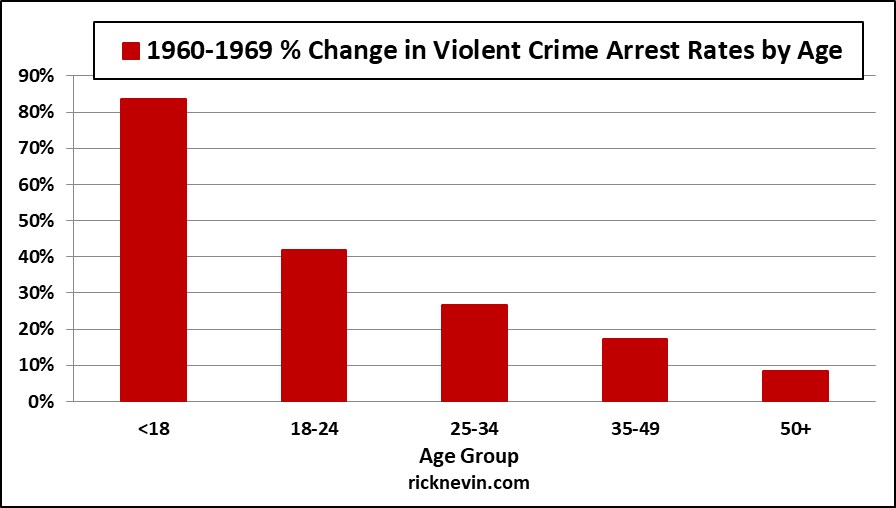
Arrests by age show that offenders under the age of 25 accounted for 77% of the total USA increase in violent crime arrests from 1960 to 1969. The outsized youth impact was partly due to baby boomers swelling the age groups when offending peaks, but violent crime arrest rates by age (arrests per 100,000 in age group) also increased over the 1960s by 83% for juveniles (under age 18) and 42% for ages 18-24.
Bonczar& Beck (1997) found that almost two-thirds of those admitted to prison for the first time had served a prior sentence to probation and a third had served a sentence in a local jail or juvenile residential placement (corrections) facility. Therefore, most of the juveniles and young adults arrested for violent crimes in the 1960s were likely sentenced to probation or incarcerated in juvenile facilities or local jails (generally for sentences of less than one year). The prison incarceration data cited by Coates does not include anyone incarcerated in juvenile facilities or local jails.
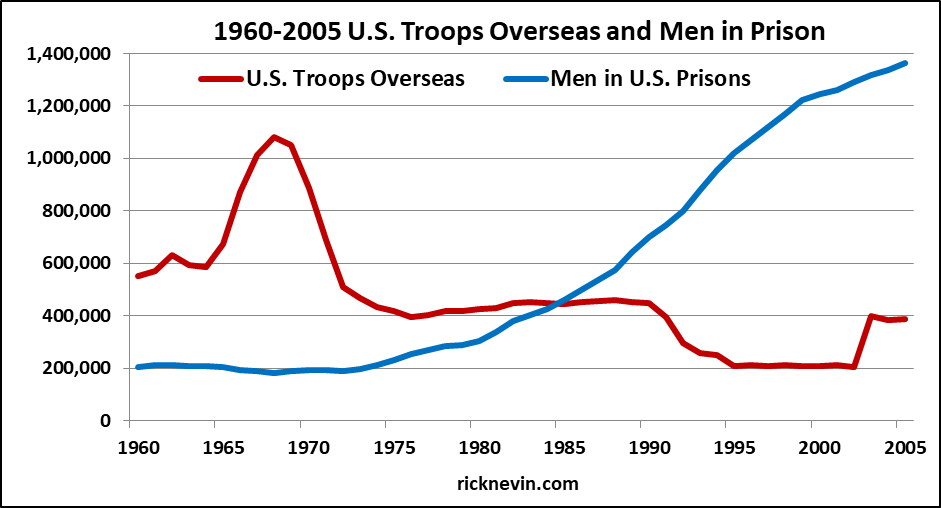
Judges in the 1960s were also known to give young male defendants a choice between incarceration and military service.There were 552,000 troops overseas in 1960 and troops overseas peaked at 1.1 million in 1968. There were 205,000 men in prison in 1960 and the number of men in prison fell to a low of 182,000 in 1968. Troops overseas fell to 885,000 in 1970 and to 507,000 in 1972. The draft ended in 1973, and the number of men in prison reached a new record high in 1974 and in every year for the next three decades.
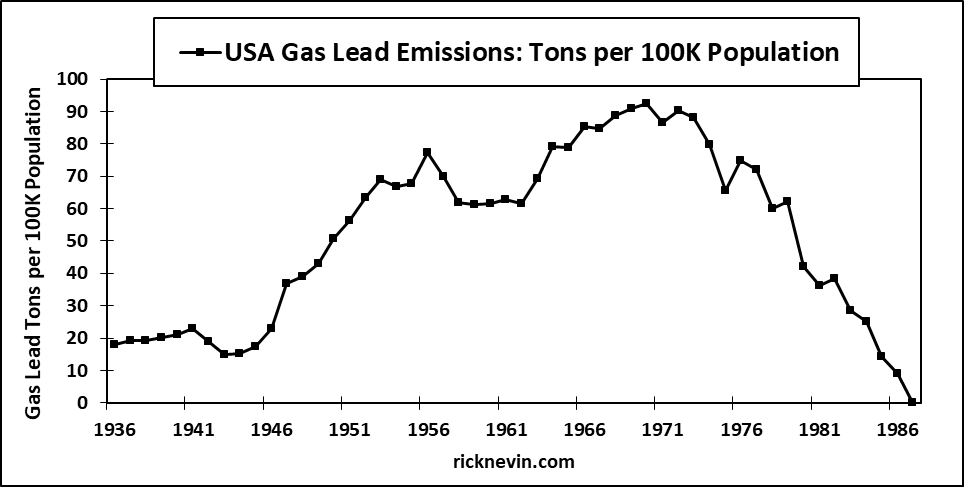
The seeds of the 1960s violent crime surge were planted in February 1923, when leaded gasoline was first sold in selected USA markets. Leaded gas production was halted in May 1925, after widely reported outbreaks of severe lead poisoning among workers at industry facilities, but production resumed in June 1926. The Great Depression sharply reduced sales in the early-1930s, but by 1940 leaded gas sales were back to levels recorded in the late-1920s (Nriagu, 1990). Gasoline rationing during World War II limited gasoline lead emissions in the early-1940s, but USA per capita use of lead in gasoline soared from the mid-1940s through 1970.
The 1960-1969 surge in the juvenile violent crime arrest rate reflects the surge in leaded gas emissions from the early-1940s through the early-1950s. Older age groups recorded smaller 1960-1969 increases in violent crime arrest rates because the increase in gas lead emissions was smaller across birth years in the 1920s and 1930s. This trend in arrest rates by age from 1960-1969 is the mirror image of arrest rates by age from 1990-2019, when juveniles had the largest 1990-2019 decline in arrest rates because they had the largest decline in lead exposure across their birth years (from the early-1970s through 2001).
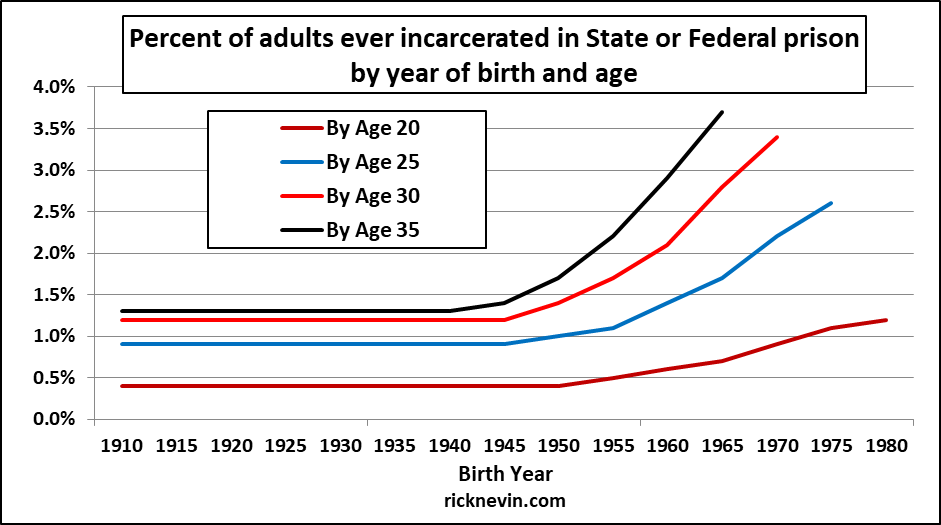
The rise in the USA incarceration rate after 1970 reflects arrest rate trends by age and the underlying causal impact of trends in birth year lead exposure. Bonczar (2003) showed how the percent of adults ever incarcerated in prison by age changed in a consistent pattern across birth years from 1910-1980. The percent of adults incarcerated before age 20 was 0.4% for birth years from 1910-1950 but rose to 1.2% for those born in 1980. The percent of adults incarcerated before age 25 was 0.9% for birth years from 1910-1945 but rose to 2.6% for those born in 1975. The percent of adults incarcerated before age 30 was 1.2% for birth years from 1910-1945 but rose to 3.4% for those born in 1970. The percent of adults incarcerated before age 35 was 1.3% for birth years from 1910-1940 but rose to 3.7% for those born in 1965. In every age group, the surge in the percent of adults ever incarcerated traces back to the same birth years when the use of lead in gasoline surged after 1945.
Bonczar (2003) reported that the number of adult residents ever incarcerated in prison increased by 3.8 million from 1974 through 2001. About a third of that increase was due to population growth, but two-thirds was due to rising rates of first incarceration. Bonczar also presented the following graph showing that the largest increase in first incarceration rates occurred among the youngest adults.
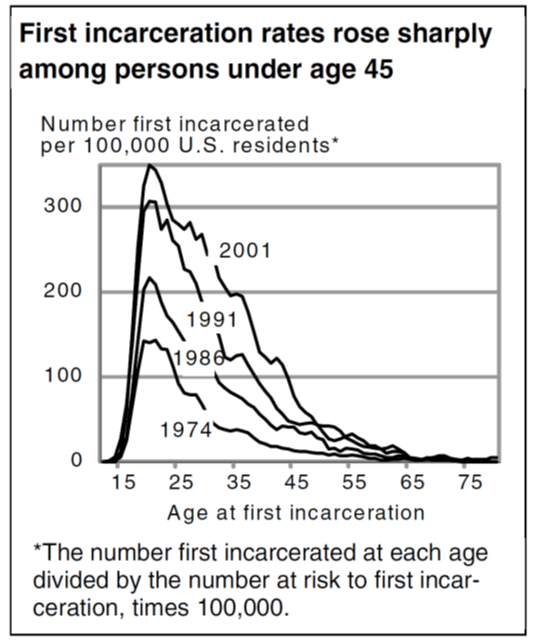
The 1974-2001 surge in first incarceration rates for young adults reflects the surge in leaded gas emissions from the mid-1940s through 1970. Adults over 55 had almost no increase in first incarceration rates from 1974-2001 because those adults were all born before the mid-1940s. This is the mirror image of incarceration rate trends by age from 2000-2019, when the youngest adults recorded the largest 2000-2019 decline in prison incarceration rates because they had the largest decline in lead exposure across their birth years (from the 1970s through 2001).
Incarceration rates by age did not rise, or fall, independent of arrest rates by age. The rise in arrest and incarceration rates from 1960 through 1990 show clear birth cohort trends that reflect the causal impact of gas lead emission trends from the 1930s through 1970. The fall in arrest and incarceration rates from the 1990s through 2019 show clear birth cohort trends that reflect the causal impact of declines in preschool lead exposure since the 1970s.