Overlooked data in the Cut50 debate
In 2015, the Marshall Project reported that criminal justice reform organizations were uniting behind the “Cut50” goal to reduce the prison population by 50% over 10 to 15 years. That report also acknowledged the following implication of this goal:
“Left mostly unsaid is that achieving the goal of this “Cut50” movement would entail touching what has long been a third-rail in criminal justice reform. To halve the prison population, sentencing would have to change not only for the so-called “non, non, nons” – non-violent, non-serious, and non-sex offender criminals – but also for some offenders convicted of violent crimes.” (Goldstein, 2015).
Five years later, the National Review was still sounding the alarm over the Cut50 proposal and its implications for releasing prisoners incarcerated for violent crimes.
“Bernie Sanders’s presidential candidacy may be moribund, but many of his policy ideas will survive among millions of his progressive followers. One of his crazier proposals is to “cut the national prison population in half,” as his campaign website puts it.
Note that Sanders is talking about prisons, not jails. Low-level offenders don’t go to prison; violent and repeat offenders do. In fact, according to the U.S. Bureau of Justice Statistics (I cite their data throughout this article), half the prison population consists of violent criminals” (Latzer, 2020).
It is unfortunate that this debate has been underway for more than half a decade with both sides apparently accepting two assumptions that are demonstrably false: (1) releasing 50% of those currently in prison is the key to achieving the Cut50 goal; and (2) releasing prisoners incarcerated for violent crimes is a departure from historic norms.
Latzer (2020) notes that he is citing U.S. Bureau of Justice Statistics (BJS) data. If he had looked at the BJS “Prisoners in 2012: Trends in Admissions and Releases” report then he would have seen the following graph on the first page.
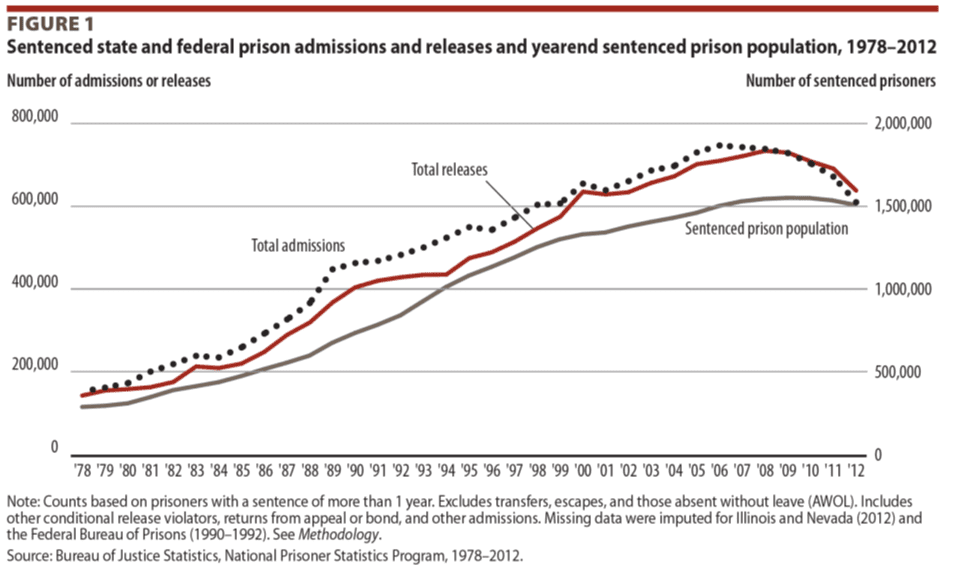
If you compare the trends for year-end sentenced prisoners (right scale) and total releases (left scale) it looks like we released about 50% of all state and federal prisoners in almost every year from 1979-2012. In fact, the percent of state and federal prisoners released every year from 1979-2019 shows no apparent relationship with the USA prison incarceration rate trend for adults (ages 18 and older).
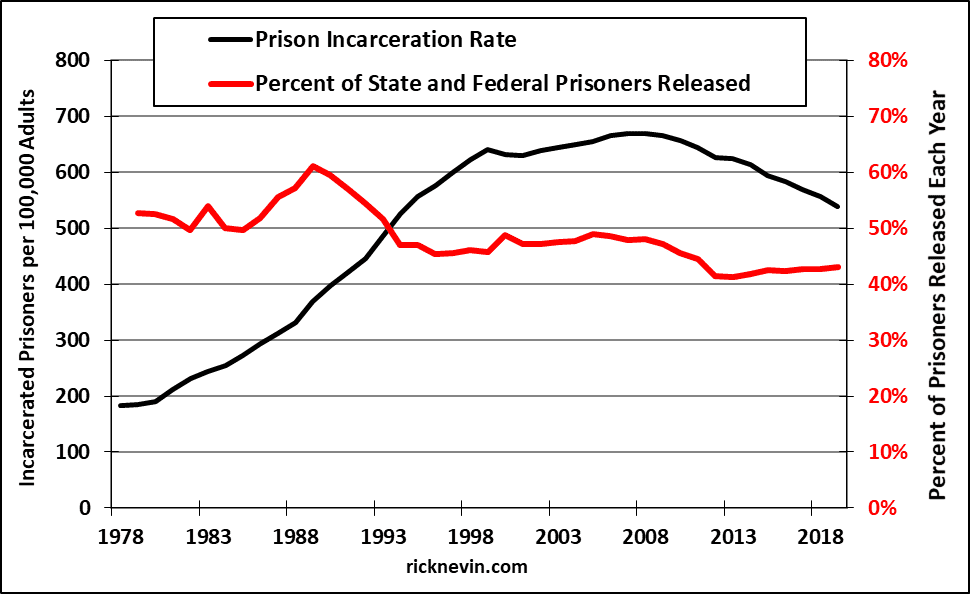
State and federal prisons released 50% to 61% of all sentenced prisoners in every year from 1979-1993 (based on total releases in each year divided by total year-end sentenced prisoners for prior year). If releasing 50% of all prisoners was the key to cutting the prison population by 50% then we would have achieved that goal in every year from 1979-1993. The prison incarceration rate increased 163% over those years, from 185 per 100,000 adults in 1979 to 486 in 1993. State and federal prisons released more than 45% of sentenced prisoners in every year from 1979-2010. The prison incarceration rate peaked at 670 per 100,000 adults in 2007 and fell to 539 in 2019, as the percent of prisoners released fell below 45% in 2011 and averaged 42% per year in 2012-2019.
The BJS also provides a single graph that should dispel the notion that releasing prisoners incarcerated for violent crimes is a departure from historic norms.
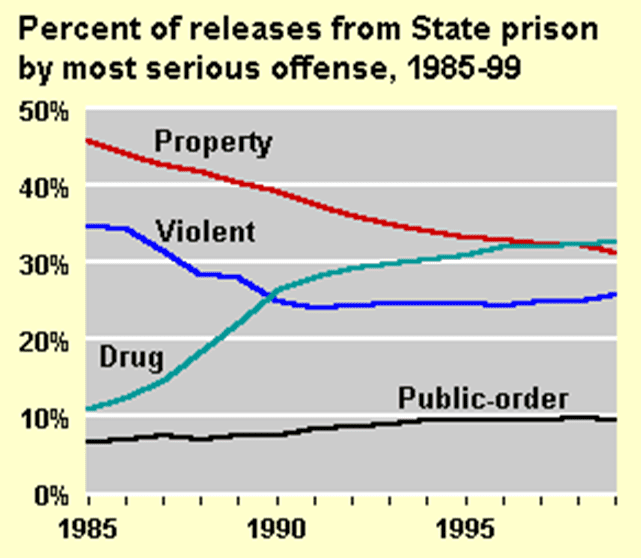
BJS: Reentry Trends In The U.S.
About one quarter of all state prisoners released from 1990-1999 were serving a prison sentence for a violent crime. In a study of Prisoners Released in 30 States in 2005, the BJS also reports that 25.7% of those prisoners released in 2005 were serving sentences for a violent crime. If releasing violent offenders was the key to cutting the prison population then we wouldn’t have to change any current practices to achieve that goal.
The graph from “Prisoners in 2012: Trends in Admissions and Releases” shows that the massive 1979-2007 increase in the sentenced prison population coincided with a massive increase in annual prisoner releases and an even larger increase in prisoner admissions. The massive increase in prisoner admissions is what caused the massive increase in the sentenced prisoner population. That increase in prison admissions was caused by a massive increase in crime, that was caused by birth year trends in lead exposure.
From 2000-2019, male incarceration rates fell 74% for ages 18-19, 54% for ages 20-24, 35% for ages 25-29, and 25% for ages 30-34. That massive decline in young adult prison incarceration rates was caused by a massive decline in young adult arrest rates, that was caused by birth year trends in lead exposure.