Update: Continuing collapse and racial convergence in juveniles sentenced to residential placement facilities
The OJJDP has updated juvenile residential placement commitment rates through 2021 (court ordered commitments per 100,000 juveniles, here). Juvenile residential placement data are generally reported for every other year. The graph below reflects reported data, and straight-line interpolation for years between years of reported data, from 1997-2021.
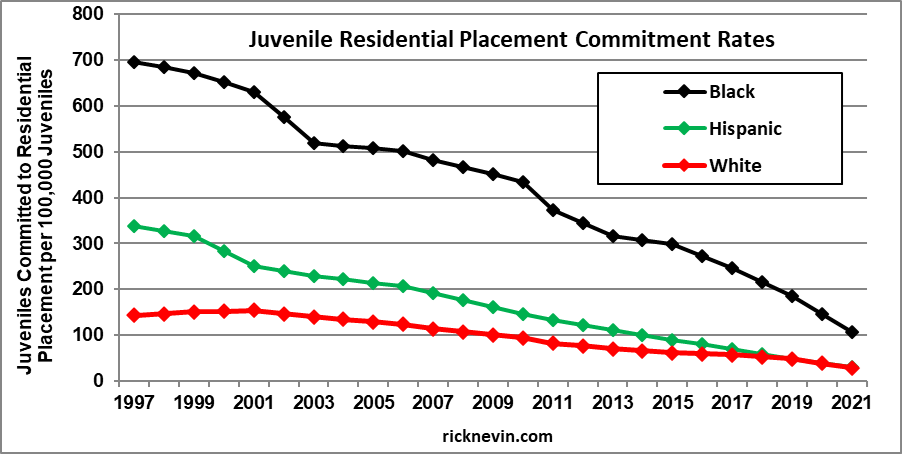
The juvenile residential placement commitment rate peaked in 1997. The decline from 1997-2021 shows the same pattern as young male imprisonment rates (here), with steeper declines for Black and Hispanic juveniles. From 1997 through 2021, the commitment rate fell 85% for Black juveniles, 91% for Hispanic juveniles, and 80% for White juveniles. The 2021 Black juvenile commitment rate was lower than White juvenile commitment rates in 1997 through 2007.
A recent Sentencing Project report on youth incarceration (here) states that “the sizable drop in juvenile facility populations since 2000 is due largely to a substantial decline in youth arrests nationwide, not to any shift toward other approaches by juvenile courts or corrections agencies once youth enter the justice system.”
In fact, the percentage decline in juvenile commitment rates since 1997 can be entirely explained by the percentage decline in juvenile arrests since 1994 (here). From 1994-2020, juvenile property crime arrest rates fell 91% and violent crime arrest rates fell 80%.