Age-Crime Curve Collapse Continues
Aug 5, 2022
“The prevalence of offending tends to increase from late childhood, peak in the teenage years (from 15 to 19) and then decline in the early 20s. This bell-shaped age trend, called the age-crime curve, is universal in Western populations” (National Institute of Justice, 2014)
This statement was not true in 2019 and it was even less true in 2020.
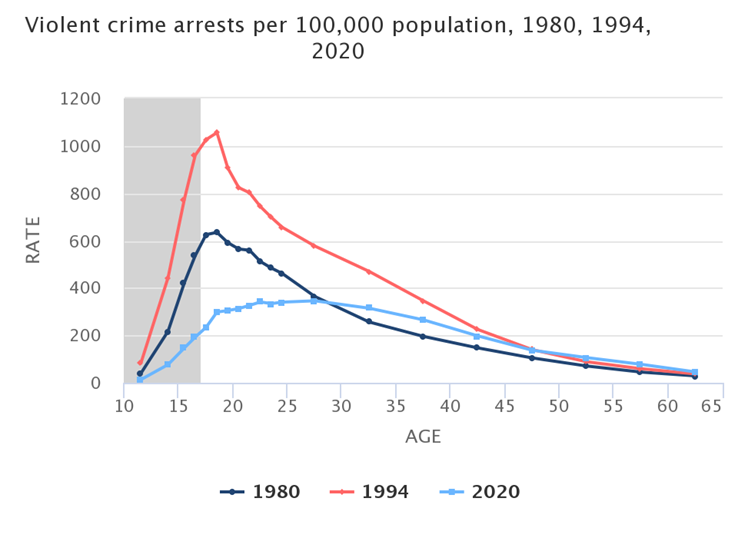
- In 1980 and 1994, the violent crime arrest rate peaked at age 18.
- In 2020, the violent crime arrest rate peaked at ages 25-29.
- In 1994, the violent crime arrest rate for ages 13-14 was 3.2 times higher than the arrest rate for ages 45-49.
- In 2020, the violent crime arrest rate for ages 13-14 was 44% lower than the arrest rate for ages 45-49.
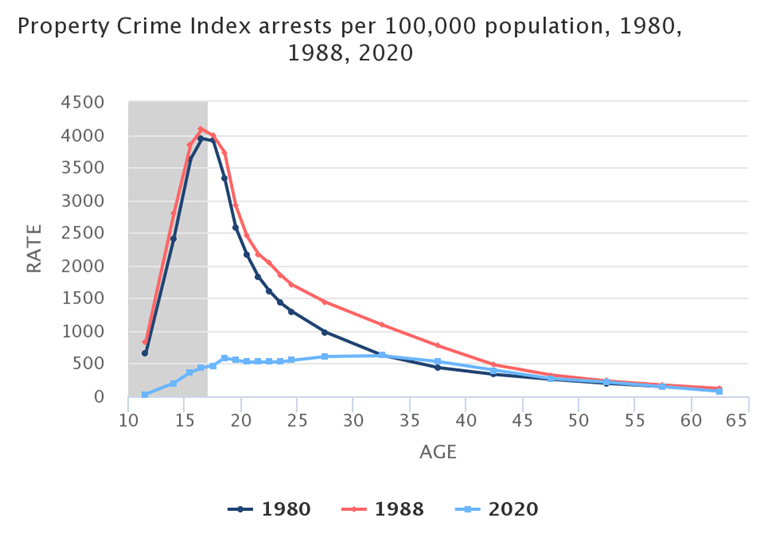
- In 1980 and 1988, the property crime arrest rate peaked at age 16.
- In 2020, the property crime arrest rate peaked at ages 30-34.
- In 1980, the age-16 property crime arrest rate was 6.3 times higher than the arrest rate for ages 30-34.
- In 2020, the age-16 property crime arrest rate was 30% lower than the arrest rate for ages 30-34.
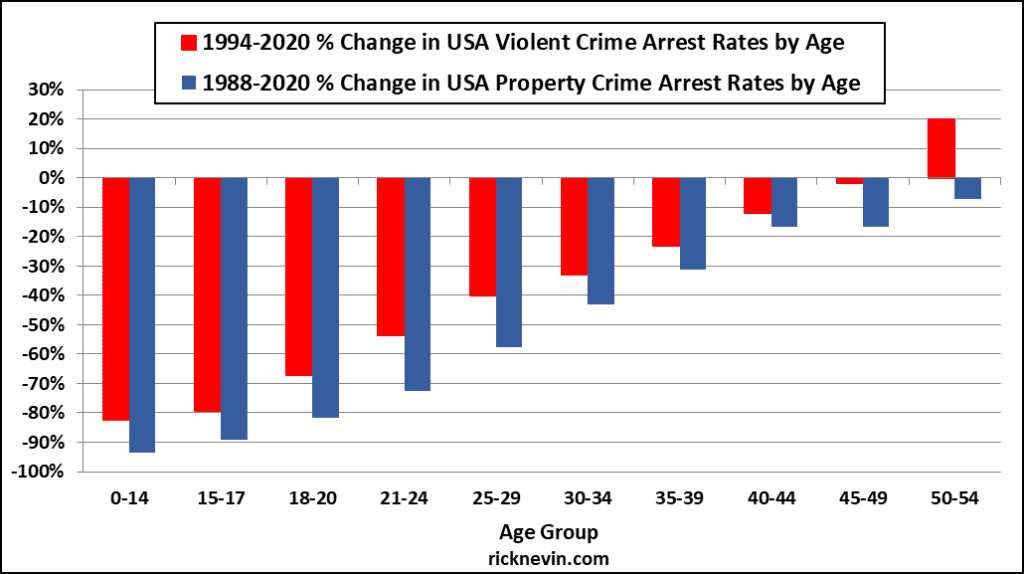
- From 1988-2020, the property crime arrest rate for ages 0-14 fell 94%.
- From 1988-2020, the property crime arrest rate for ages 50-54 fell just 7%.
- From 1994-2020, the violent crime arrest rate for ages 0-14 fell 82%
- From 1994-2020, the violent crime arrest rate for ages 50-54 rose by 20%
Is there any other criminology theory – other than the impact of birth year trends in lead exposure – that can explain this extraordinary pattern in arrest rate trends by age over the last 3 decades?
Posted in Uncategorized