The Age-Crime Curve has Collapsed
In the field of criminology, the Age-Crime Curve is settled science.
The Age-Crime Curve
“The prevalence of offending tends to increase from late childhood, peak in the teenage years (from 15 to 19) and then decline in the early 20s. This bell-shaped age trend, called the age-crime curve, is universal in Western populations …
However, specific versions of the curve vary in significant ways. The curve for violence tends to peak later than that for property crimes. … The curve is higher and wider for young males (especially minorities) growing up in the most disadvantaged neighborhoods.” (National Institute of Justice, 2014)
The criminology consensus on this subject is no longer supported by arrest rates reported by the Office of Juvenile Justice and Delinquency Prevention (OJJDP). The following OJJDP graphs of violent crime and property crime arrest rates by age show that the age-crime curve has collapsed.
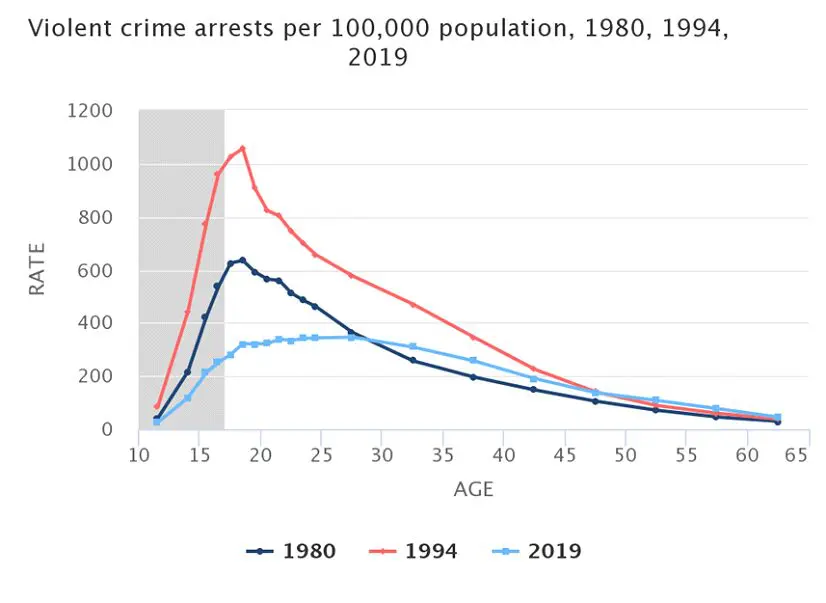
- In 1980 and 1994, the violent crime arrest rate peaked at age 18.
- In 2019, the violent crime arrest rate peaked at ages 25-29.
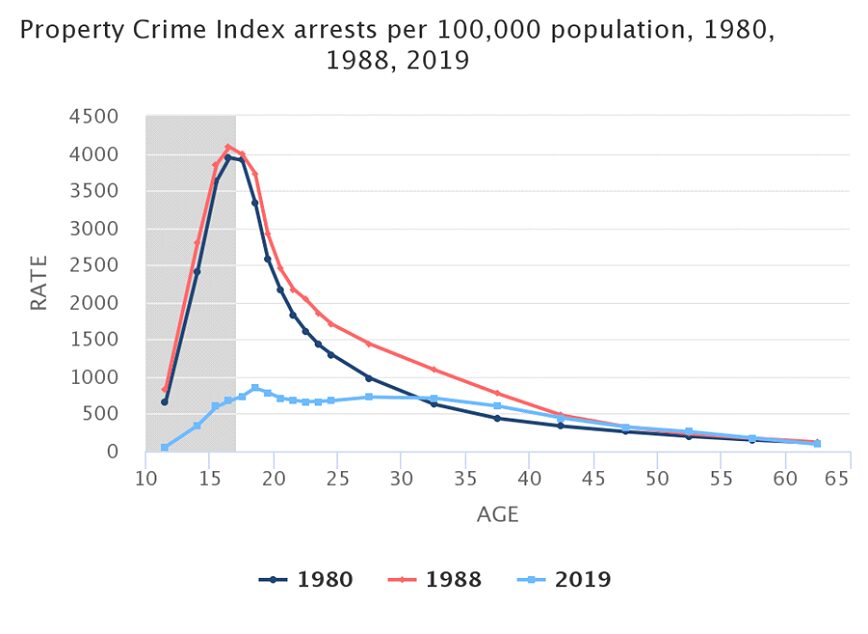
- In 1980 and 1988, the property crime arrest rate peaked at age 16.
- In 1980, the age-16 property crime arrest rate was 6.3 times higher than the arrest rate for ages 30-34.
- In 2019, the age-16 property crime arrest rate was 5% lower than the rate for ages 30-34.
The collapse of the age-crime curve was not sudden. It happened gradually over the last 20 years, tracking earlier birth year trends in lead exposure. Nevin (2007) observed that the beginning of that collapse was already evident in violent crime arrest rates through 2001.
“Youths ages 16-22 in 1994 were all born before the early-1980s fall in gasoline lead, and the age-16 arrest rate was 29% higher than the age-22 rate in 1994 … The 22-year-olds in 2001 were also born before the early-1980s decline in lead exposure, but the 16-year-olds were born in the mid-1980s, and the 2001 age-16 arrest rate was 12% lower than the age-22 arrest rate. (Nevin, 2007)
For 60 years, the juvenile property crime arrest rate has tracked the rise and fall of average preschool blood lead with a time lag of about 17 years. That time lag reflects the delayed juvenile crime impact of lead exposure during a critical period of brain development before birth and in the first years of life.
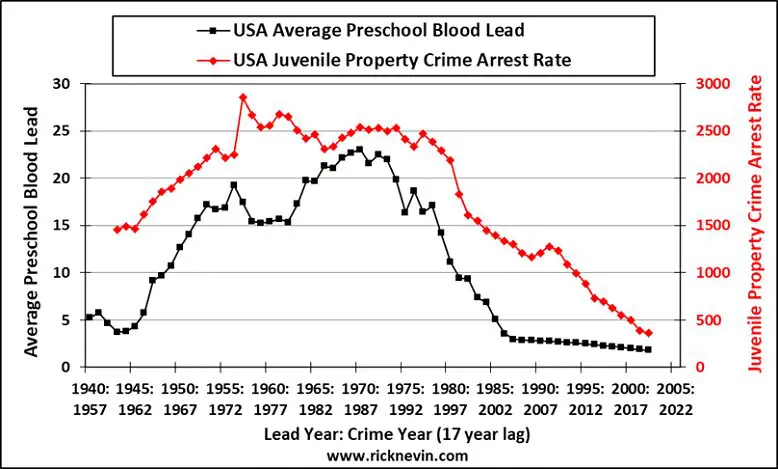
The 1960 juvenile property crime arrest rate was the lowest rate recorded from 1960 through 2001. The 2019 juvenile property crime arrest rate was 75% lower than the 1960 rate. National arrest rates by age have not been reported yet for 2020, but 2020 data reported by Florida, California, Texas, and six other states indicate that the juvenile property crime arrest rate fell to another record low in 2020.