Update: The Pipeline to Prison Has Run Dry
I first wrote about the pipeline to prison running dry in 2015. At that time, I cited available data through 2013 showing stunning declines in juvenile arrest rates and juveniles in state and federal prisons, adult jails, and juvenile residential placement (corrections) facilities.
“From 1991-2013,… juvenile (under 18) arrest rates fell by 63% for violent crime and 71% for property crime…
From 2000 to 2013, there was also a 69% decline in the number of juveniles in adult prisons… Juveniles in local jails also fell 40% from 2000-2014, and the number of youths in residential placement fell 50% from 1999-2013″. (Nevin, 2015)
The pipeline to prison has gotten even drier since then:
- From 1991-2019, juvenile arrest rates fell 68% for violent crimes and 86% for property crime.
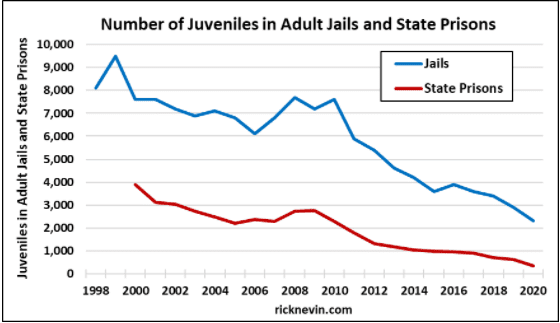
- The number of juveniles in state prisons fell from 3,892 in 2000 to just 338 in 2020, down 91%.
- The average daily population of juveniles in adult jails fell from 9,500 in 1999 to 2,300 in 2020, down 76%.
- The number of juveniles in residential placement fell from 108,802 in 2000 to 36,479 in 2019, down 66%.
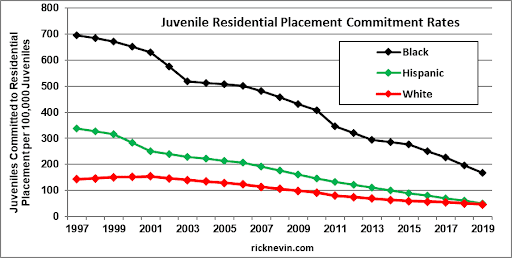
The juvenile residential placement commitment rate (court ordered commitments per 100,000 juveniles) peaked in 1997. The decline from 1997-2019 by race and ethnicity shows the same pattern as young male imprisonment rates, with steeper declines for Hispanic juveniles and much steeper declines for Black juveniles.
(Note: Juvenile residential placement data are generally available for every other year. The graph below reflects straight-line interpolation for years between years of reported data.)
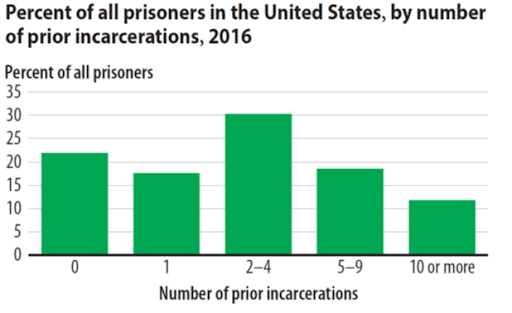
A recently released Profile of Prison Inmates in 2016 offers some insight into how youth incarceration trends will inevitably affect the overall prison population over the next few decades. In 2016, only 22% of state and federal prisoners were serving their first sentence to incarceration; 78% had served at least one prior sentence in a juvenile correctional facility, a local or county jail, or a state or federal prison (including 30% who had served five or more prior incarceration sentences).
The profile of prison inmates in 2016 also compares the state prisoner population by age in 2016 versus 2004. Comparable data is also available for 2020.
- In 2004, inmates ages 18-24 accounted for 17.2% of all state prisoners.
- In 2016, inmates ages 18-24 accounted for 10.3% of all state prisoners.
- In 2020, inmates ages 18-24 accounted for just 8.8% of all state prisoners.
Over the next few decades, who will replace the 78% of aging state and federal prisoners who have served at least one prior incarceration sentence? Who will replace the 30% of prisoners who have served five or more prior incarceration sentences?
- In 2004, inmates ages 45 and older accounted for 19.2% of all state prisoners.
- In 2016, inmates ages 45 and older accounted for 31.3% of all state prisoners.
Doug Berman at Sentencing Law and Policy made the following comment about the 2020 imprisonment rate decline reflecting a decrease in prison admissions much more than any increase in prison releases:
“I am thus tempted to joke that, like lots of other segments of our society, America’s mass incarceration system has also had “supply chain” issues that has impacted its usual functioning. Whether these patterns have continued into 2021 and beyond as this pandemic lingers on will be worth watching closely.” (Berman, 2021)
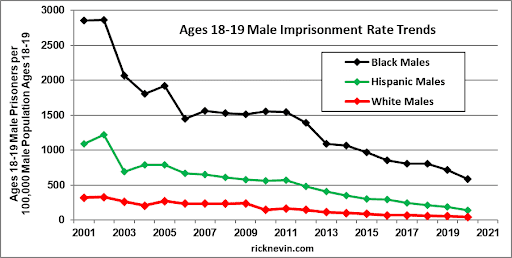
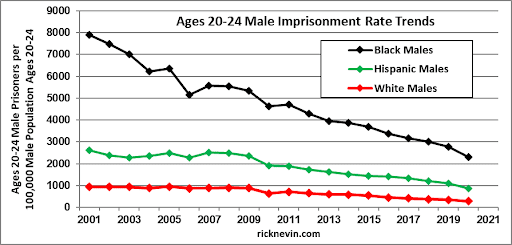
The ongoing decline in the state and federal prison population is a supply chain issue. That isn’t a joke, and it isn’t a change in the usual functioning of the prison system. The criminal supply chain impact has been evident since the stunning decline in juvenile crime over the 1990s, followed by declines in juvenile commitments to residential placement dating back to 1997, declines in juveniles held in adult jails since 1999, declines in juveniles in prisons since 2000, and imprisonment rate declines for men ages 18-24 dating back to 2002.
In hindsight, the criminal supply chain, caused by birth year trends in lead exposure, also explains trends from 1960 through 1990, when crime and incarceration were rising.
Whether these patterns continued into 2021 is a question we can already answer for one state. Alabama reports monthly data on prisoners by age, for January 2000 through November 2021.
- In January 2000, Alabama prisons held 6,021 inmates ages 25 and younger.
- In December 2020, Alabama prisons held 1,614 inmates ages 25 and younger.
- In November 2021, Alabama prisons held 1,438 inmates ages 25 and younger.