The NYC crime decline and “better policing”
New York City’s crime decline is often attributed to better policing, but some tactics have been controversial, including the “stop, question, and frisk” tactic that peaked at about 700,000 stops in 2011.
“A large percentage of those stopped were minorities, and critics and plaintiffs in federal court proceedings questioned whether all these stops could have been based on reasonable suspicion, especially when only 6 percent resulted in arrests” (Kelling & Bratton, 2015).
Stops were reduced to about 45,000 in 2014, down 94% from 2011. Some critics worried that this would result in a crime resurgence, but they were mistaken: From 2011-2019, New York City murders fell 38%, robberies fell 32%, and burglaries fell 42% (NYPD, 2020). Those familiar with the research literature on preschool lead exposure and crime were not surprised by this ongoing crime decline.
“New York City had extensive slum demolition and reduced incinerator lead emissions in the 1960s, and banned lead paint in 1960, resulting in a large reduction in lead poisoning. … New York City and St. Louis both reported about 1200 children per year with blood lead over 30 mcg/dL from 1981-1985, when New York’s population was 16 times larger. Chicago, Detroit, Baltimore, Philadelphia, and St. Louis report 3-4% of children tested in 1998-1999 had blood lead over 20 mcg/dL, but New York City prevalence over 20 mcg/dL was just 0.4%.” (Nevin, 2007)
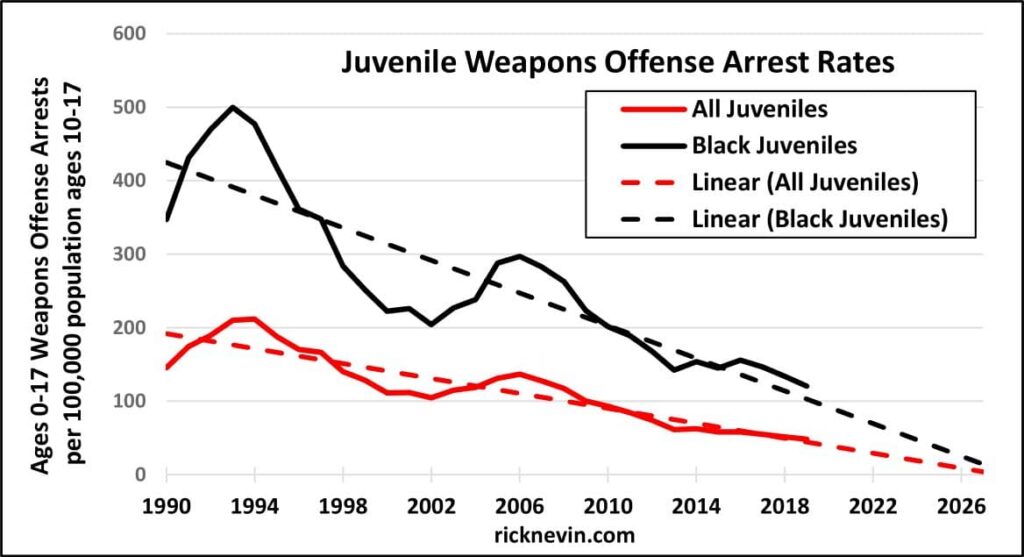
A major goal of stop and frisk was to get guns off the street, targeting teenagers and young men who might have gang affiliations. In addition to the steep decline in NYC stops after 2011, legal challenges to stop and frisk also curtailed this tactic in other cities after 2011, but juvenile weapons arrest rates and gang influence have followed earlier trends in lead exposure with no apparent change in trends after 2011.
The juvenile weapons offense arrest rate fell 67% from 1990-2019, including a 43% decline from 2011-2018. The 1990-2019 weapons offense arrest rate trendlines for all juveniles and for black juveniles are on track to converge near zero in 2026. The 2019 black juvenile weapons offense arrest rate was 43% lower than the 1994 weapons offense arrest rate for all juveniles.
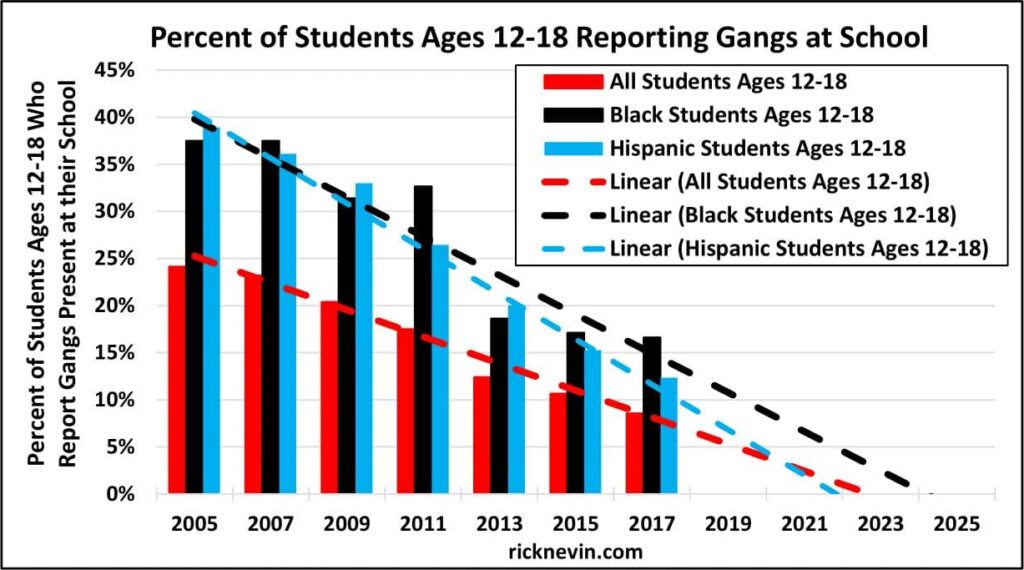
The percent of students ages 12-18 reporting gangs present at their school peaked at 24.2% in 2005 and fell to 8.6% in 2017. The percent of black students ages 12-18 reporting gangs present at their school peaked at 37.5% in 2005 and fell to 16.6% in 2017. In recent years, gangs that originated in Latin America have been a source of particular concern for law enforcement, but the percent of Hispanic students ages 12-18 reporting gangs present at their school peaked at 38.9% in 2005 and fell to 12.3% in 2017 (NCES, 2018). Trendlines for 2005-2017 show that the percent of students with gangs present at their school is on track to hit zero around 2022-2024.
Kelling and Bratton (2015) emphasize that stop, question, and frisk (SQF) is not the same thing as Broken Windows policing:
“Unlike SQF, Broken Windows policing is not a tactical response based on reasonable suspicion of possible criminality. Rather, it is a more broadly based policy mandating that police will address disorderly illegal behavior, such as public drinking and drug use, fights, public urination, and other acts considered to be minor offenses, with responses ranging from warning and referral to summons and arrest. Most often in these cases, police have witnessed the crime in question and are acting on probable cause …
… Contrary to conventional wisdom, citizens almost invariably are more concerned about disorderly behavior than about major crimes, which they experience far less frequently. We have attended countless meetings with citizen groups in high-crime areas, and, almost without exception, disorderly behavior and conditions are the central concerns. …
Ample evidence makes clear that Broken Windows policing leads to less crime. The academics who attribute crime drops to economic or demographic factors often work with macro data sets and draw unsubstantiated, far-fetched conclusions about street-level police work, which most have scarcely witnessed. …
Current crime levels don’t stay down by themselves because of some vaguely defined demographic or economic factor. … The shooting doesn’t happen, the robbery doesn’t happen, the burglary doesn’t happen because the police have prevented them.” (Kelling & Bratton, 2015)
Law enforcement experts need to reconsider the last sentence of this quote. If the police deserve the credit for the NYC crime decline since 1990, then doesn’t that imply that an earlier generation of police officers deserve the blame for the rise in crime from the 1950s through the 1980s? My father-in-law was one of those police officers. He joined the NYPD in the late-1940s after serving in WWII as a Marine in the Pacific Theatre. He served 30 years with the NYPD, rising to the rank of Captain. His generation of NYPD officers were not the reason why the shootings, the robberies, and the burglaries all increased relentlessly throughout their decades with the NYPD. They knew that there was something horrible happening to our society, in NYC and across the USA. They didn’t know what was causing it, but they knew it was something no police force in the country could prevent. It was like a slow-motion zombie apocalypse: The deterioration was imperceptible from week to week or month to month, but it seemed to get worse every year, and the societal breakdown across decades was overwhelmingly obvious. Saying “the robbery doesn’t happen, the burglary doesn’t happen because the police have prevented them” is also a completely implausible explanation for robbery and burglary trends over six decades in the USA, Canada, Britain, and Australia that have all followed earlier preschool blood lead trends in each nation with the same time lags.
My father-in-law was an avid reader who was curious about everything. That open-minded curiosity and lifelong commitment to self-education, combined with his daughter’s choice in marriage, resulted in my father-in-law being the one and only law enforcement expert who was also extremely well-informed about the research linking preschool lead exposure and crime. Based on that knowledge, he had no doubt that lead poisoning was the “something horrible” that caused the multi-decade rise in crime, and lead poisoning prevention caused the crime decline after 1990.
My father-in-law also supported Broken Windows policing. The police definitely do need to address all aspects of maintaining public order, including misdemeanors like simple assaults (fights), vandalism, and public drunkenness and drug use. At the same time, declines in juvenile and young adult arrest rates, tracking earlier declines in lead exposure, suggest that we might need to rethink how police officers are held accountable for making arrests. Any explicit or implicit understanding that “good” officers make more arrests could put patrol officers in an impossible position if there is evidence that preschool lead exposure trends affect misdemeanor offending as well as more serious crimes. How many arrests should we expect from patrol officers today if arrest rate trends suggest that they are likely to witness far fewer simple assault, vandalism, and public drunkenness and drug use offenses?
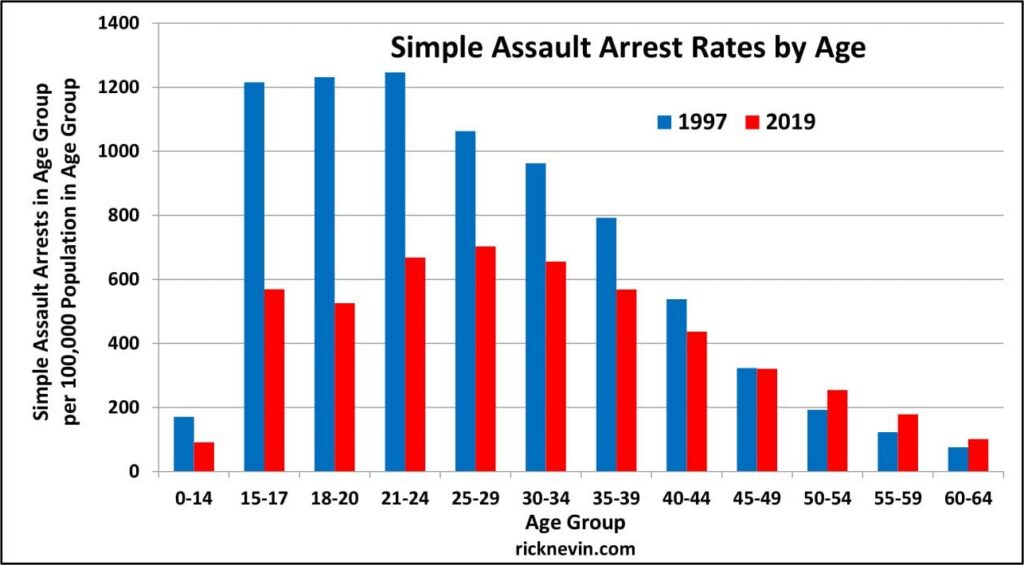
Changes in simple assault arrest rates by age from 1997-2019 show cohort patterns similar to those for serious violent and property crime arrest rates, reflecting birth year trends in lead exposure. From 1997-2019, the simple assault arrest rate fell about 50%, for ages 0-24, and fell about 30% for ages 25-39, but increased by more than 30% for ages 50-64.
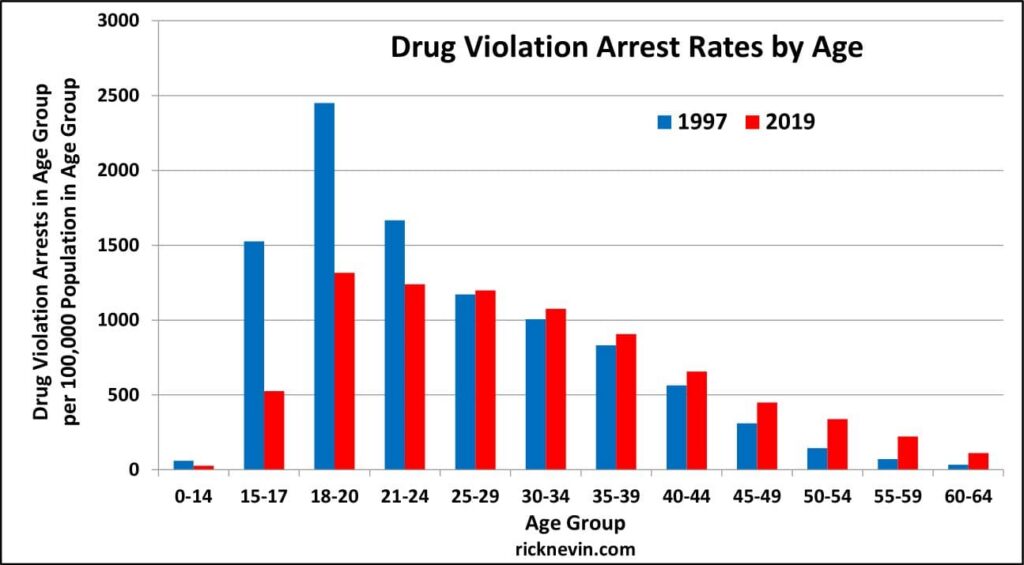
Changes in drug violation arrest rates show a similar pattern. From 1997-2019, the drug violation arrest rate fell 66%, for ages 15-17, 46% for ages 18-20, and 26% for ages 21-24, but increased by more than 200% for ages 55-64.
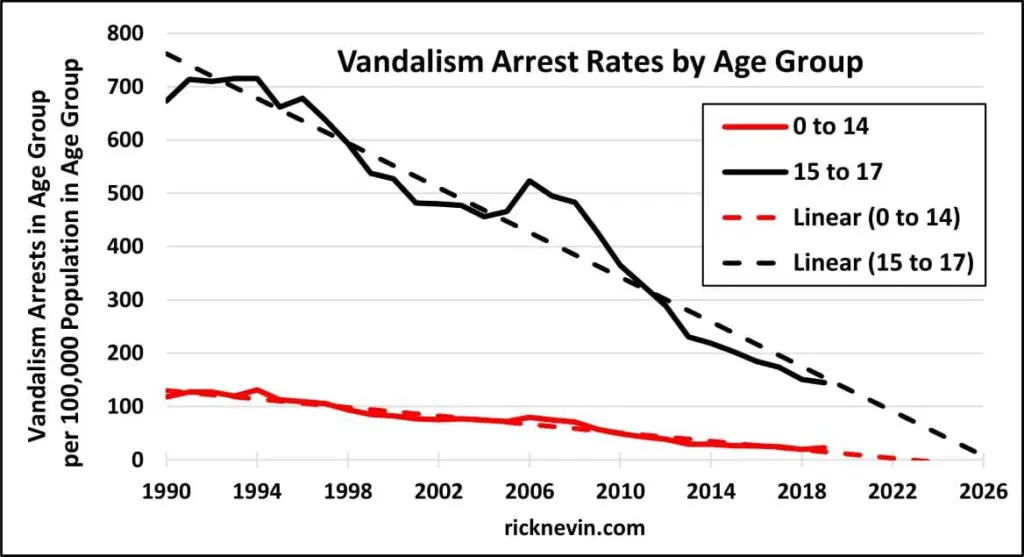
Juveniles accounted for 40% of all vandalism arrests in 2000, but juveniles accounted for just 18% of all vandalism arrests in 2019. The 1990-2019 vandalism arrest rate trendline for ages 0-14 is on track to hit zero in 2023, and the trendline for ages 15-17 is on track to hit zero in 2026.
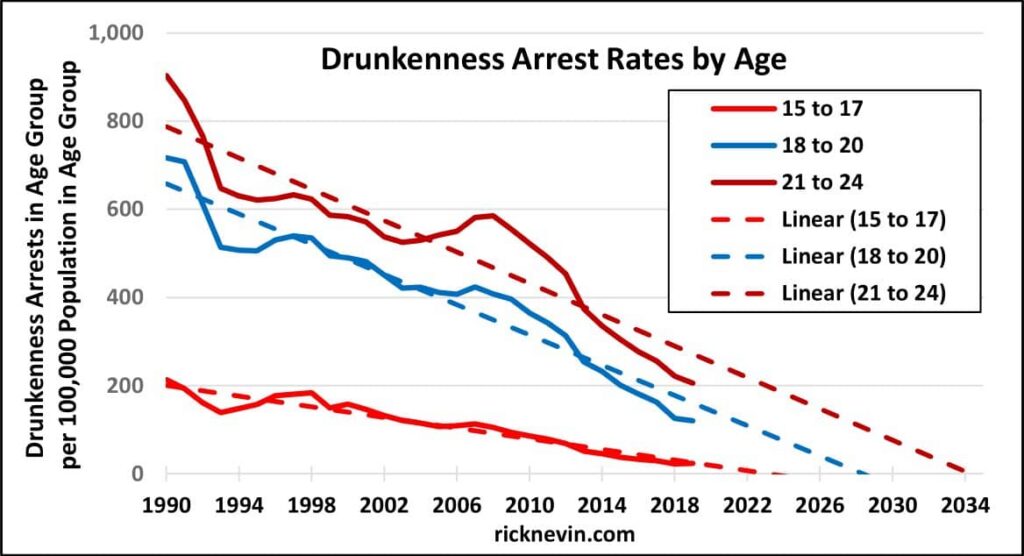
Arrest rates for public drunkenness have been falling since the early-1980s, after Mothers Against Drunk Driving was formed in 1980, followed by passage of the National Minimum Drinking Age Act of 1984. The 1980s decline cannot be explained by lead exposure trends, but ongoing declines do show some evidence of cohort trends: The 1990-2019 drunkenness arrest rate trendline for ages 15-17 hits zero in 2023, the trendline for ages 18-20 hits zero in 2028, and the trendline for ages 21-24 hits zero in 2034.
All of these trends are good news, and the police should be applauded for addressing both major crimes and less serious disorderly illegal behavior, as requested by citizen groups in many neighborhoods. At the same time, veteran precinct commanders should not expect young officers today to make the number of simple assault, drug violation, vandalism, and public drunkenness arrests that good police officers made 20 or 30 years ago.