Has any other crime theory predicted crime trends with so much accuracy, over so many years, in so many nations?
Hill (1965) states that “the strongest support for the causation hypothesis may be revealed” when an action is taken to prevent a suspected cause of disease, and later trends show “experimental evidence” of cause and effect: “Is the frequency of the associated events affected?” In other words, does the hypothesized causal relationship have predictive power? Does removing the suspected cause have the expected effect in the real world?
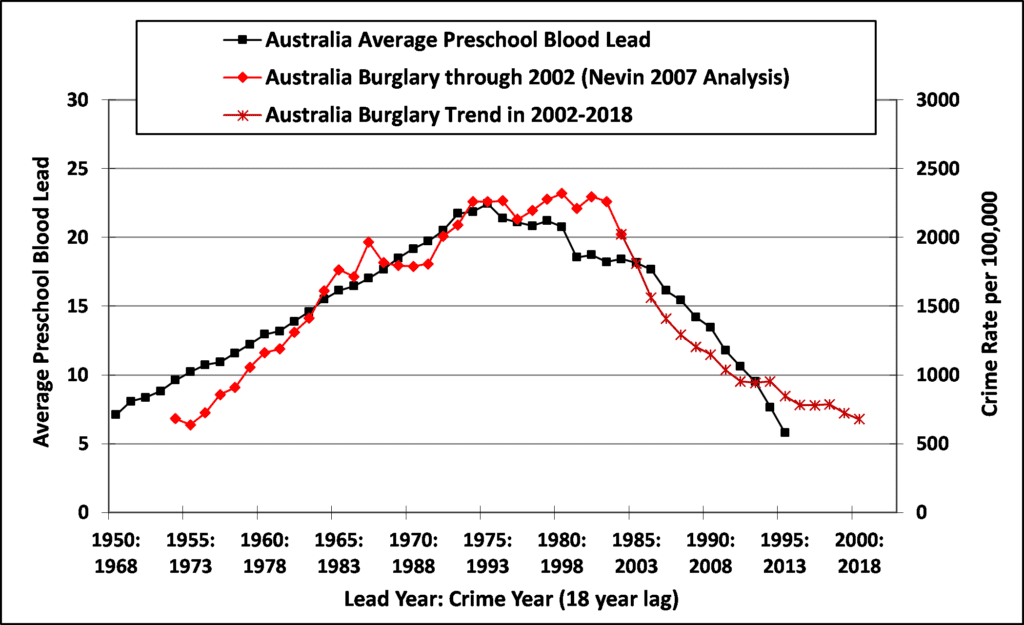
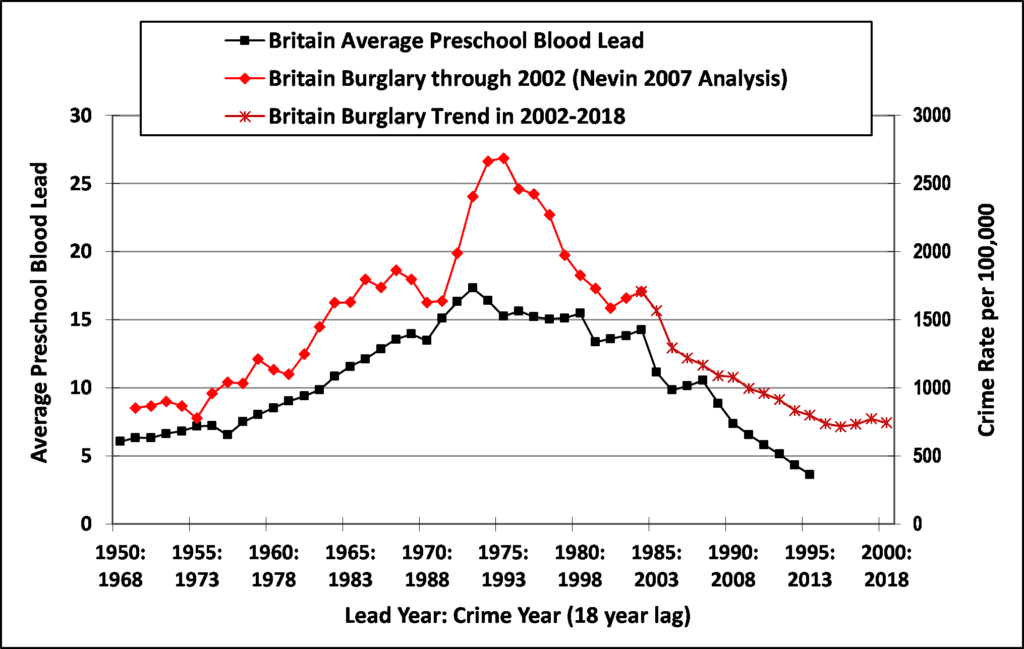
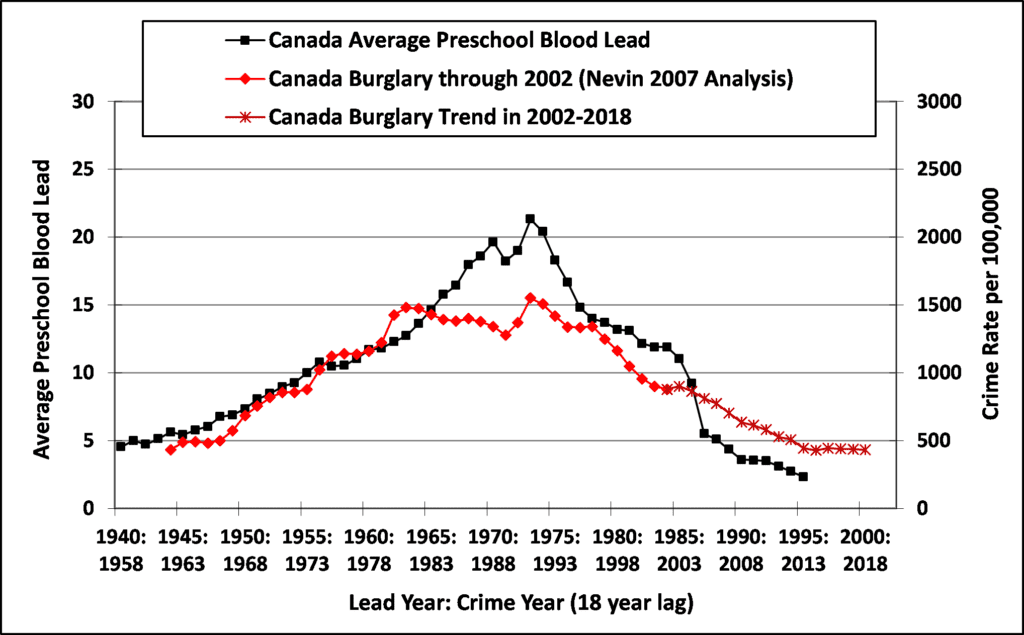
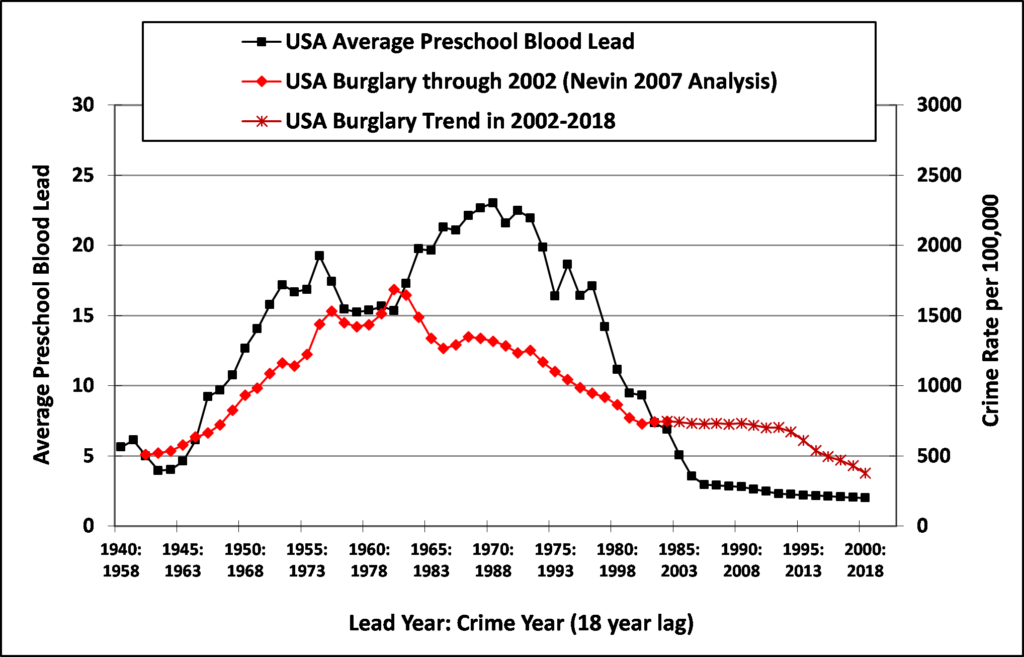
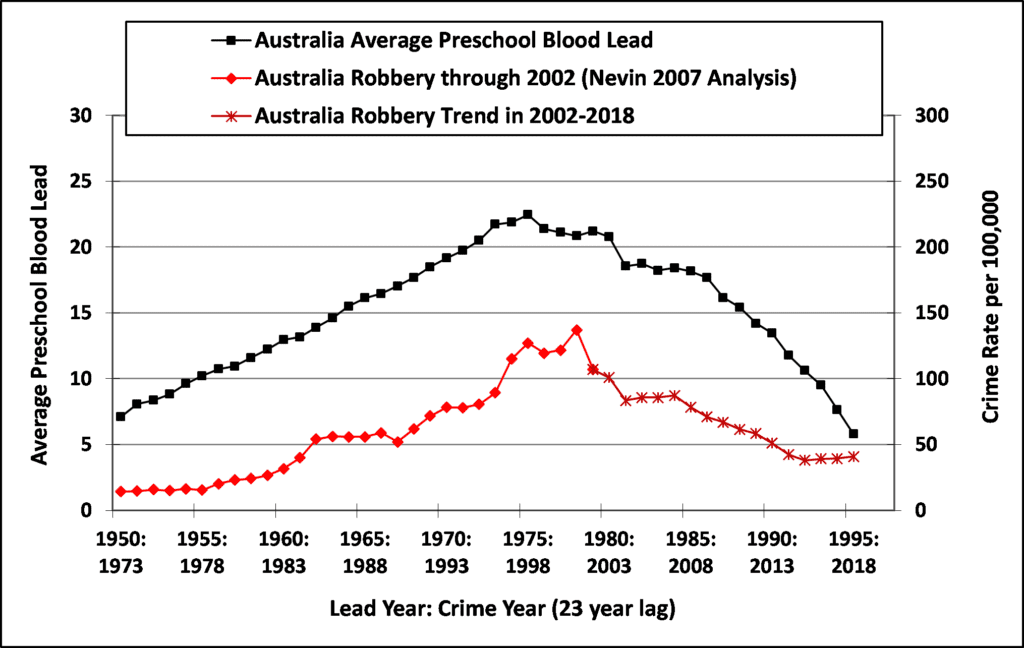
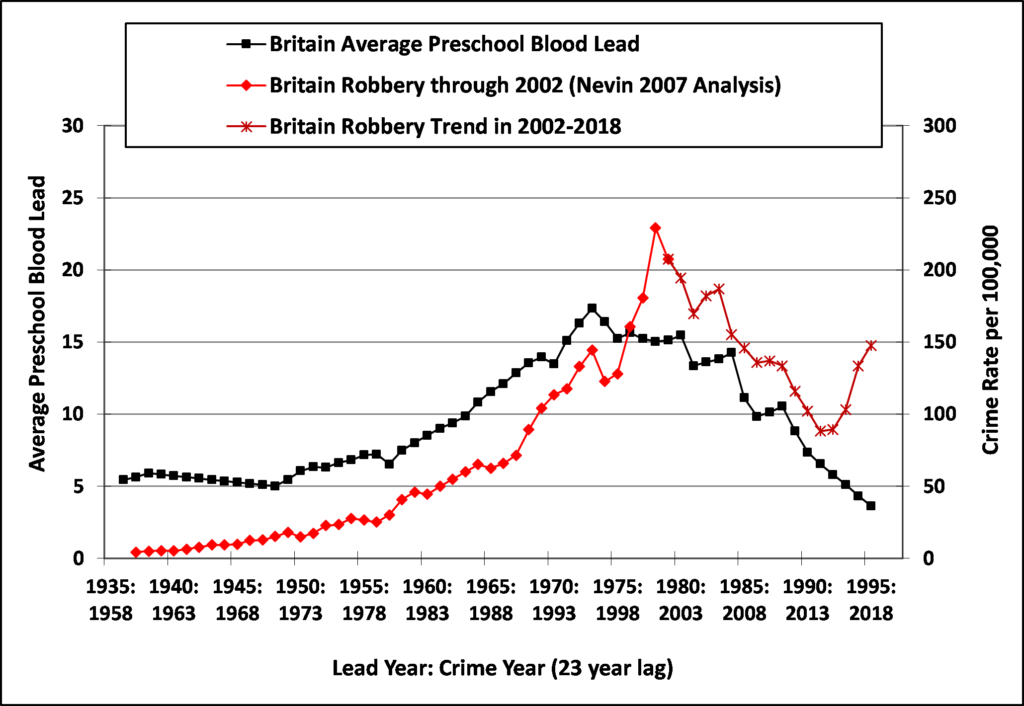
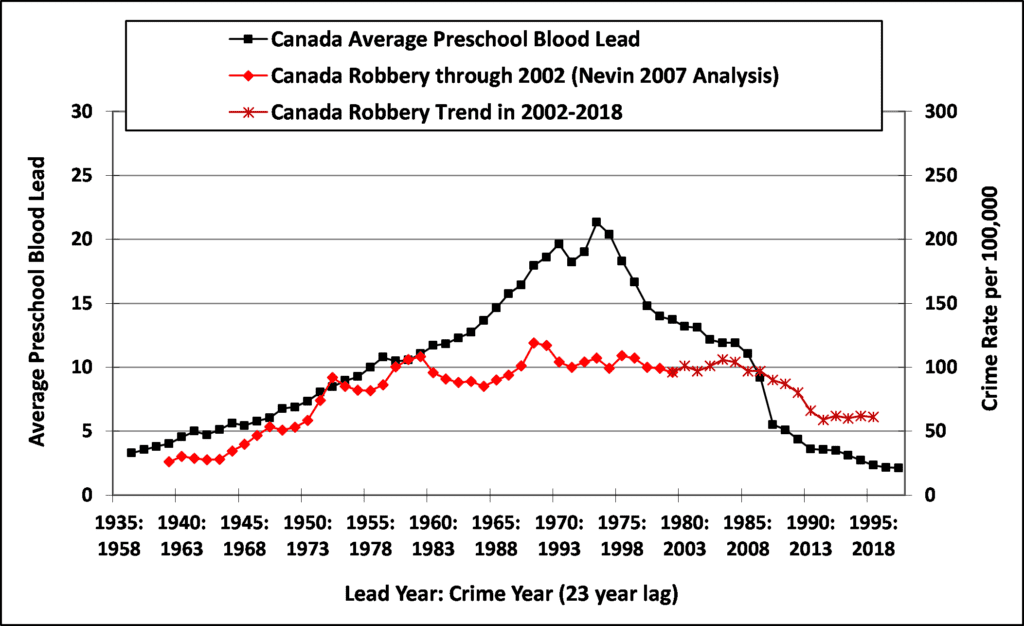
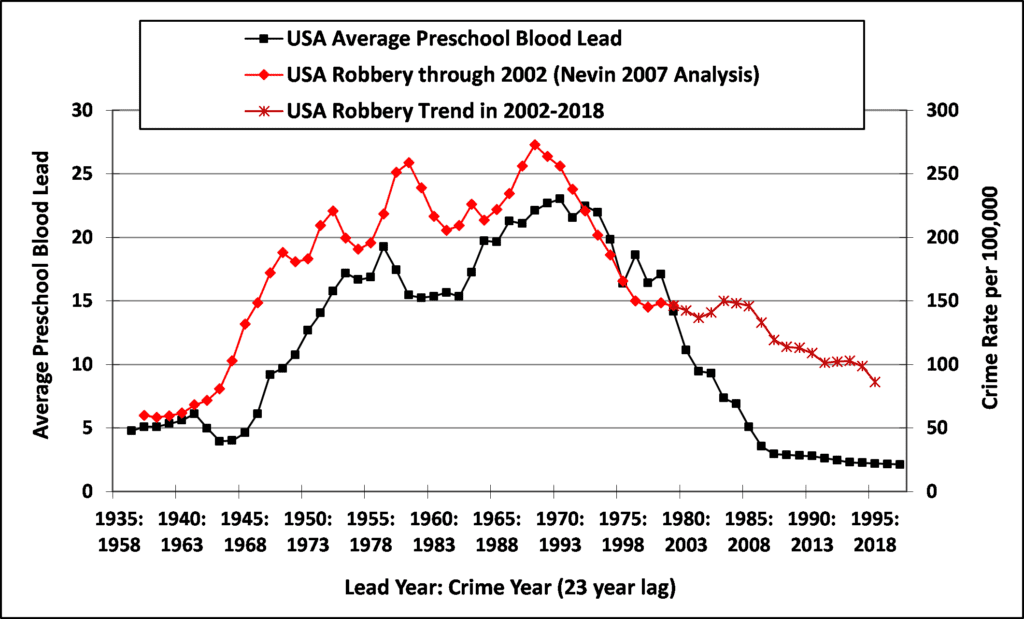
Nevin (2007) found that trends in preschool blood lead explained up to 91% of temporal variation in national burglary rates with an 18-year lag, and up to 89% of variation in robbery rates with a 23-year lag, based on analysis of a wide range of time lags to identify the “best-fit” with the highest statistical significance. The best-fit lags for robbery and burglary are consistent with lead-induced neurobehavioral damage in the first years of life and peak ages of offending for each crime. Property crime arrest rates have historically peaked at ages 15 to 20 and fallen sharply by age 30, consistent with an 18-year lag for burglary. Violent crime arrests have historically peaked at ages 15 to 24 and declined through age 50, consistent with a 23-year lag for robbery. Nevin (2007) analyzed crime data through 2002, and the predictive power of this causal relationship is evident in 2002-2018 burglary and robbery trends in Canada, Australia, Britain, and the USA.
Burglary rates fell 50% or more from 2002-2018 in all four nations. Robbery rates in Britain and Australia peaked in 2001, but Canada and USA robbery rates peaked 10 years earlier, reflecting the earlier phase-out of leaded gasoline in Canada and the USA. Australia’s robbery rate fell 62% from 2002-2018. The Canadian robbery rate fell almost 50% from 1991-2018, including a 39% decline from 2002-2018. The USA robbery rate fell 68% from 1991-2018, including a 41% decline from 2002-2018. The police recorded robbery rate in Britain fell 57% from 2001-2014, but then increased from 2014-2018. The U.K. Office for National Statistics believes that part of the trend since 2014 reflects a real increase in robberies, but notes that the 2014-2018 rise also reflects crime recording changes since 2014 that made “substantial contributions” to the 2014-2018 rise in recorded robberies. Except for the anomalous 2014-2018 robbery trend in Britain, the 2002-2018 burglary and robbery trends for Canada, Australia, Britain, and the USA have all tracked earlier preschool blood lead trends reported for each nation.
Has any other criminology theory predicted the direction and magnitude of burglary and robbery rate trends with so much accuracy, over so many years, in so many nations around the world?