Time-Precedence: Reasonable Doubt … in 2002
At a minimum, the time-precedence causation indicator requires that the suspected cause precede the effect. The best-fit time lags for lead and crime trends, with a shorter lag for property crime than for violent crime, provide especially compelling evidence of time precedence. The same lags are evident around the world, with divergent international crime trends explained by earlier differences in lead exposure trends. The USA and Canada used much more lead in gasoline than other nations did before 1970, but substantially reduced leaded gas use more than a decade before substantial reductions in Britain and Australia, explaining the following international crime trend comparisons:
“The 1974 USA burglary rate was 50% and 98% higher than rates in Britain and Australia, respectively, but the 2002 USA rate was 56% and 63% lower than rates in Britain and Australia. The Canadian robbery rate was five times the rate in Britain in 1962, but the 2002 Canadian rate was less than half the rate in Britain.” (Nevin, 2007)
A different perspective on time-precedence led Cook and Laub (2002) to question the link between lead exposure and crime trends because black male homicide victimization rates fell across several age groups over the 1990s. The lead-crime theory does suggest that there should be a cohort effect, with younger age groups showing earlier and more pronounced impacts from lead exposure trends, but this should affect offending by age, not victimization by age. While there has been a historical correlation between homicide offending and victimization by age, the phaseout of USA leaded gasoline use from the mid-1970s through the mid-1980s especially affected the number of juveniles killed by other juveniles over the 1990s. From 1990-2000 there was a 54% decline in juvenile homicide victims killed by other juveniles, but only a 17% decline in juvenile homicide victims killed by adults.
Cook and Laub also made the following important statement about how further research could help to answer the questions they had in 2002:
“Given the volatility in the rates of juvenile violence, forecasting rates is a risky business indeed. Effectively narrowing the range of plausible explanations for the recent ups and downs may require a long time horizon, consideration of a broader array of problem behaviors, and comparisons with trends in other countries.” (Cook & Laub, 2002)
Research since 2002 has addressed these additional perspectives, and the evidence all points to lead exposure as the key determinant of crime trends. Trends in other countries have confirmed that lead exposure trends explain violent and property crime trends across decades and around the world. Long time horizon data on British caution and conviction rates for indictable offenses also show clear cohort effects consistent with the lead-crime theory.
“Age-14 British males had the highest caution and conviction rate for indictable offenses in 1958, but peak offending shifted to age 18 by 1997. … Males ages 12-14 in 1958, born as gas lead exposure rose after World War II, had higher offending rates than older teens born before that rise in lead exposure. By 1997, … offending rates rose for older teens and adults born over years of rising gasoline lead use.” (Nevin, 2007)
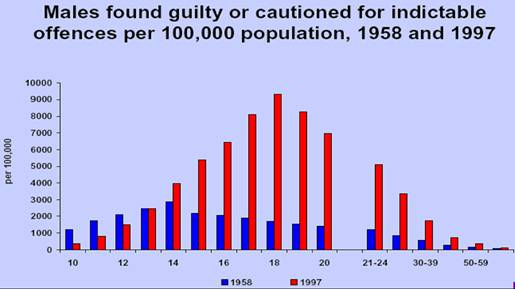
Source: U.K. Home Office, “Forty Years of Crime and Criminal Justice Statistics
Long time horizon data on USA property crime arrest rates also show clear cohort effects that support the lead-crime theory.
“The overall USA property crime rate was about the same in 1970 and 2003, but the property crime arrest rate for youths under age 15 fell 45% from 1970-2003 … and the arrest rate for adults over-24 rose 58%. The 45% drop in the under-15 arrest rate compares offenders in 1970 born near the 1956 interim peak in gasoline lead versus offenders in 2003 born after the early-1980s fall in gasoline lead. The 58% increase in the over-24 arrest rate compares adults in 1970 mostly born before 1950 versus their 2003 counterparts born before 1980.” (Nevin, 2007)
An even longer time horizon shows that age groups associated with rising USA arrest rates are now older, as the peak years of lead exposure recede into the past. From 1988-2017, property crime arrest rates fell 86% for ages 0-14, and 29% for ages 30-34, but rose 18% for ages 50-54.
Crime declines in other nations after the phase-out of leaded gasoline also show cohort trends. In Britain, juvenile cautions and convictions for burglary fell 87% from 2001-2018, far outpacing the 57% decline in Britain’s overall burglary rate from 2002-2018. Canada’s overall crime rate fell 17% from 2008-2018, as Canada’s youth arrest rate fell 48%. From 2008-2018, Australia burglary arrest rates fell 36% for ages 20-24 but increased 112% for ages 45-49, and Australia robbery arrest rates fell 31% for ages 20-24 but increased 50% for ages 45-49.