Why are prisons “getting Whiter”?
A February 2021 WaPo commentary by Keith Humphreys began with the following observation: “Prisons are getting Whiter.” That fact was also made clear in 2020 Featured Content from the Bureau of Justice Statistics (BJS) showing 2008-2018 trends in prison incarceration rates: “From 2008 to 2018, the imprisonment rate dropped 28% among black residents, 21% among Hispanic residents, and 13% among white residents.”
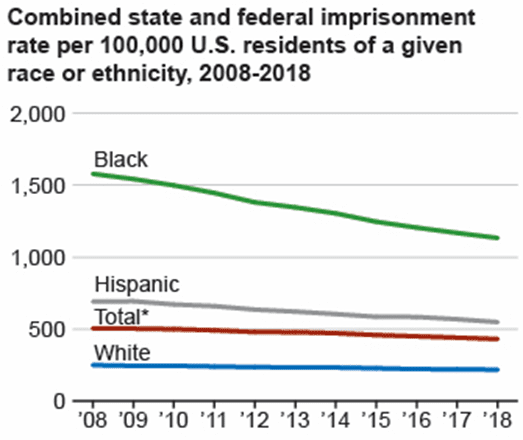
Source: BJS (2020)
Humphreys states that the cause of declining black incarceration is “still debated, but the collapse in urban crime most likely played a role.” Yes, crime trends explain incarceration trends, but you have to consider trends by race and age to see how earlier lead exposure trends explain incarceration trends by race. Nevin (2009) showed this relationship for 2000-2006 incarceration trends.
“incarceration rates fell from 2000 to 2006 for all men under age 30, reflecting the decline in preschool blood lead since the mid-1970s, but incarceration rates are rising for men over 40, born when lead poisoning was epidemic. The overall 30-39-year-old male incarceration rate rose slightly from 2000 to 2006, but the 30-39-year-old rate for black males fell 12%, reflecting … slum clearance birth years”. (Nevin, 2009)
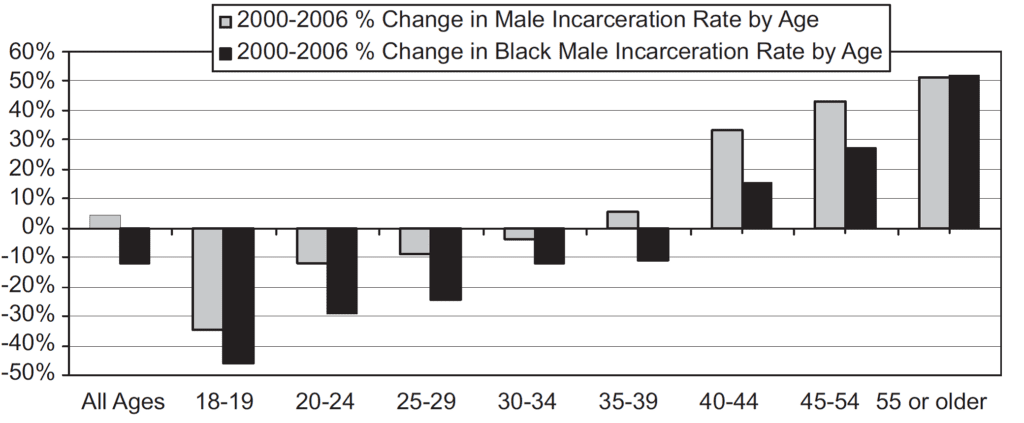
Source: Nevin (2009) Fig. 9.
“Many city children suffered severe lead poisoning from 1950 to 1970 due to additive exposure to air lead and deteriorated lead paint in city slums. Atmospheric emissions from gas lead affected blood lead even in rural areas, but traffic caused severe city exposure because 55% of emissions settled within 20 km of the roadway … Most 1950-1970 slum housing was built around 1900 when the use of heavily leaded interior paint was common. Lead dust hazards are still present in [many] homes with deteriorated interior lead paint (Jacobs, 2002), and lead paint chip ingestion is often a factor in severe lead poisoning … Slum demolition reduced severe lead paint hazards in the 1960s, but 25% of city children tested still had blood lead over 40 mcg/dL when gas lead use peaked around 1970. Gilsinn (1972) found that substandard housing prevalence explained 95% of local variation in children over 40 mcg/dL in 1970 … Blacks accounted for 15% of central city households in 1960, but occupied 56% of substandard city housing, and the percent of all central city blacks in substandard housing was 25% in 1960 and 16% in 1966 … Per capita gas lead use fell from 1956 to 1962 but hit new highs from 1966 to 1974, when 62% of blacks under 6 lived in central cities, versus 24% of whites under age six … Average blood lead for black 2-year-olds in Chicago and New York City fell about 30% from 1970 to 1978, but the late 1970s USA average for black children ages 6-36 months was still 50% above the white average”. (Nevin, 2009)
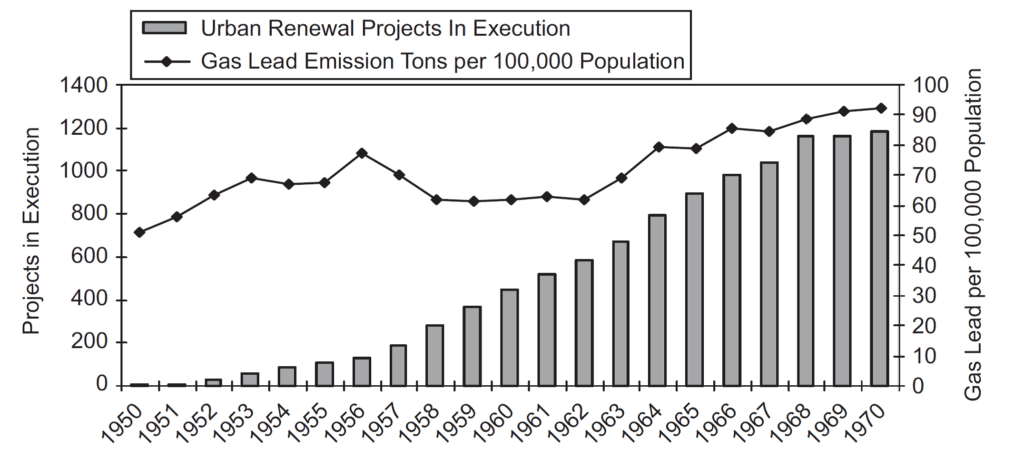
Source: Nevin (2009) Fig. 8: “Per capita gas lead use was little changed as urban renewal projects increased 100-fold from the early 1950s through the 1960s, where a single project often involved demolition of a large number of dilapidated slum units with severe lead paint hazards. Slum demolition was especially extensive in black neighborhoods, reducing the racial difference in average preschool lead exposure”.
The evidence that preschool blood lead for black children in central cities peaked in the early-1960s has since been confirmed by a study in Cleveland. This 2010 study found that lead concentrations in tooth enamel formed in early childhood from 1936 to 1993 peaked in 1960-1975 at five times the levels in teeth formed in 1936-1950 and 1986-1993. Tooth lead concentrations for this urban and predominantly (86%) black population were found to be highly correlated with available blood lead data for black children in cities and supported an estimated 48 mcg/dl average blood lead among black children in central cities from 1960-1975. The most severe lead poisoning cases were found in tooth enamel lead concentrations associated with birth years in the early-1960s.
These findings are also consistent with public health reports stating: ”In the 1960s many inner city hospitals had large numbers of comatose and convulsing children with lead poisoning, with fatality rates of 5-28%” (Jackson Commentary, 1998). Convulsions and coma are associated with preschool blood lead above 70 mcg/dl (CDC, 2001)
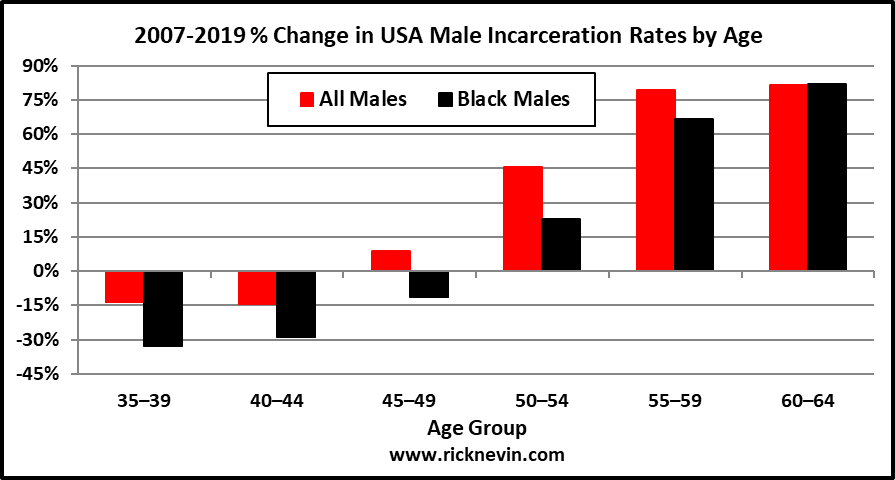
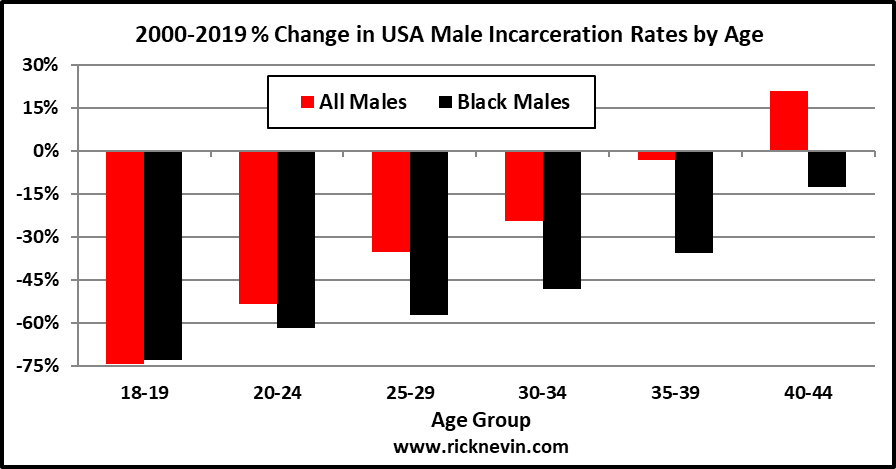
Male incarceration trends from 2000-2019 show the same birth year effects seen in the 2000-2006 data. Incarceration rates fell for all men under 40 from 2000-2019, reflecting the decline in preschool blood lead since the mid-1970s. Black men under 40 had larger 2000-2019 incarceration rate declines because black children recorded steeper preschool blood lead declines after the mid-1970s. The incarceration rate increased by 21% from 2000-2019 for all men ages 40-45, but fell by 13% for black men ages 40-45, reflecting the earlier decline in black preschool blood lead due to 1960s slum clearance.
The BJS began reporting data on older prisoner age groups in 2007. Incarceration rates increased from 2007-2019 for all men and black men over the age of 50. Among prisoners ages 60-64, the prison population has not gotten any whiter since 2007. From 2007-2019, incarceration rates for all men and black men ages 60-64 increased by 82%.