Plausibility: This is your brain on lead
Hill (1965) says it is helpful if a causal hypothesis is biologically plausible. The plausibility of preschool lead exposure affecting learning and behavior has been demonstrated by extensive research showing adverse neurochemical, subcellular, and cellular effects on brain development (Banks, 1997). There are also “toxicological effects with behavioural concomitants at exceedingly low levels of exposure”. (Lidsky & Schneider, 2003)
Wolf (2014) notes that lead poisoning “wreaks a lot of havoc on the central nervous system. So pinpointing one – or even a few – molecular switches by which the heavy metal turns on aggression has been challenging.” The impact on gray and white matter growth is well known, however, and the association between brain growth and criminal offending has been recognized in landmark Supreme Court death penalty decisions.
In Roper v. Simmons (2005), the Supreme Court held that execution is an excessive sanction for crimes committed by juveniles, citing the “susceptibility of juveniles to immature and irresponsible behavior” indicative of “diminished culpability”. An American Psychological Association (APA) Roper brief (2004) cited magnetic resonance imaging (MRI) evidence of a “biological dimension to adolescent behavioral immaturity”.
“The frontal lobes, especially the prefrontal cortex, play a critical role in the executive or “CEO” functions of the brain … involved when an individual plans and implements goal-directed behaviors. … MRI studies indicate this executive area of the brain is one of the last parts of the brain to reach maturity.
… white matter significantly increases during adolescence [as] a substance called myelin is wrapped around brain cell axons. Myelination improves the connectivity of neural tracts by insulating the axon thereby greatly speeding up the communication between cells, allowing the brain to process information more efficiently and reliably.” (APA, 2004)
This APA brief highlighted MRI research by Giedd (1999) showing a surge in gray matter growth around puberty, followed by white matter growth that improved connections between neurons. In another study, Sowell (1999) compared MRI scans at ages 12-16 to scans at ages 23-30 showing a large difference in frontal lobe white matter. The APA cites this as evidence of neurodevelopment affecting juvenile offending, but Bartzokis (2001) reported MRI evidence of frontal lobe white matter growth through age 50. He explains: ”What keeps growing is the myelin … It literally allows your brain to work in concert; you’re not as prone to impulse” (Health Scout, 2001). White matter growth through age 50 suggests that improving brain function could explain why arrest rates decline with age well beyond adolescence.
Moffitt (1993) described how Adolescence-Limited offenders account for most juvenile crime, but some youths become more violent Life-Course-Persistent offenders. Even among chronic offenders, Sampson and Laub (2003) found that offending increased sharply after age 10, property crimes peaked during adolescence and fell almost 90% by the mid-20s, and violent offenses peaked in the early-20s and fell through age 50. These findings are consistent with offending being affected by the gray matter growth surge around puberty, rapid white matter growth through the mid-20s, and ongoing white matter growth through age 50.
The APA Roper brief included an Office of Juvenile Justice and Delinquency Prevention (OJJDP) graph to illustrate that violent offense rates “build steeply to age 18 and then fall”, but the most recent version of that OJJDP graph no longer supports that claim. In 1994, the violent crime arrest rate peaked at the age of 18, but in 2019 it peaked in the late-20s. From 1994-2019, violent crime arrest rates fell 73% for juveniles, and 65% for ages 18-20, but rose 21% for ages 50-54.
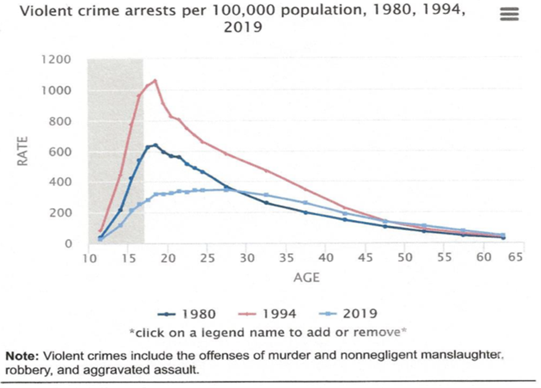
If brain function affects crime, then violent crime arrest rate trends by age suggest that brain function from 1994 to 2019 improved for juveniles but deteriorated for older adults. That conclusion is consistent with birth year trends in lead exposure and University of Cincinnati MRI studies (Cecil, 2008; Brubaker, 2009) showing that lead exposure impairs the same types of brain development linked to “diminished culpability” in Roper.
“One set of scans found that lead exposure is linked to production of the brain’s white matter – primarily a substance called myelin, which forms an insulating sheath around the connections between neurons. Lead exposure degrades both the formation and structure of myelin, and when this happens, says Kim Dietrich, one of the leaders of the imaging studies, “neurons are not communicating effectively.” Put simply, the network connections within the brain become both slower and less coordinated.
… A second study found that high exposure to lead during childhood was linked to a permanent loss of gray matter in the prefrontal cortex”. (Drum, 2013)
Lead exposure impacts on neurodevelopment provide a new perspective on research by Raine (1997) comparing brain scans for murderers and matched controls. This study showed that murderers had dysfunction in the prefrontal cortex and the corpus callosum (the largest white matter structure in the brain, facilitating communication between cerebral hemispheres). This provided direct evidence to support earlier speculation that corpus callosum dysfunction may cause a biological predisposition to violence. Moreover, this dysfunction and “consequent lack of hemispheric integration could contribute to the abnormal asymmetries of function … previously observed in antisocial and violent groups” (Raine, 1997). An analysis of 43 imaging studies by Yang and Raine (2009) also found “significantly reduced prefrontal structure and function in antisocial individuals”. Raine has since stated that the rise and fall of leaded gasoline exposure is “the only single cause that can both explain the precipitous rise in violence from the ’70s, ’80s and ’90s and also the drop that we’ve been experiencing” (NPR, 2013).
Males (2020) has observed that the “near disappearance of adolescent property offenses” has been led by an even more astonishing drop among the youngest juveniles: “From 1978 to 2018, felony and misdemeanor property arrests of Californians under age 12 plunged by 99%, from 10,419 to 116.” He concludes that these trends “stunningly refute … [the] notion that teenagers do “incredibly stupid” things due to their undeveloped brains”.
Youth behavior trends do not discredit the research on brain growth but do show that teenagers today do not have their father’s (or grandfather’s) teen brain. The Cecil (2008) and Brubaker (2009) studies showing how lead impairs neurodevelopment reflect brain scans for participants in the Cincinnati Lead Study (CLS). The CLS enrolled pregnant women from 1979-1984 and followed their children born over those years. The average preschool blood lead for CLS participants was 13 mcg/dl. The average preschool blood lead for all USA children was above 15 mcg/dl in every year from 1952-1978, and above 21 mcg/dl every year from 1966-1973 (Nevin, 2007). This means that MRI studies cited in the APA Roper brief (studies published in 1999) were not showing us the normal development of a completely healthy, lead-free teenage brain. Those MRI studies examined people born across decades when almost all children had preschool blood lead levels now linked to an increased risk of “toxicological effects with behavioural concomitants”. In other words, that MRI research showed us the teenage brain on lead.
Research showing white matter growth from adolescence through age 50 is consistent with arrest rates that decline with age. In fact, arrest rates in 2019 were higher for youths than adults over 50, despite youths in 2019 having had far less preschool lead exposure than adults over 50 (born before the phase out of leaded gasoline). Silbergeld (1992) observed that lead exposure during critical periods of brain growth can cause permanent damage, but neurotransmission effects could be reversible absent continuous exposure. More generally, behavioral neuroscience recognizes that “the nervous system can modify its organization and ultimately its function throughout an individual’s lifetime”, a property called brain plasticity (Kolb & Whishaw, 1998).
Another analysis of CLS participants found that preschool blood lead over 5 mcg/dl is associated with a higher risk of violent and property crime arrests, and arrest rates rise with each 5 mcg/dl increase in blood lead (Wright, 2008). The average preschool blood lead for all USA children was close to 5 mcg/dl in the 1930s and early-1940s and well above 5 mcg/dl in every year from 1947 through 1984 (Nevin, 2007). National blood lead survey data collected from 1976-1980 found that 99.8% of preschool children had blood lead above 5 mcg/dl (and 88.2% had blood lead above 10 mcg/dl).
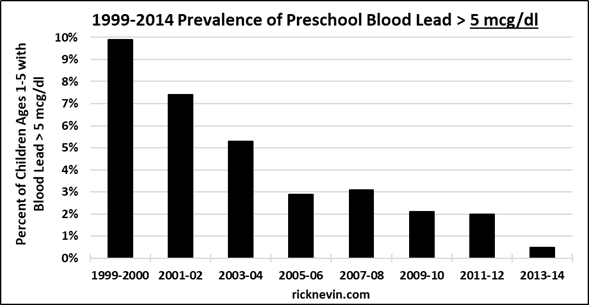
In 1960, the first year of FBI recorded data, the juvenile property crime arrest rate was 1457 per 100,000 population ages 10-17. Most juvenile offenders in 1960 were born before 1947, when average preschool blood lead was close to 5 mcg/dl, but that average included many children with blood lead above the 5 mcg/dl level now linked to a higher risk of arrests. The 1960 juvenile property crime arrest rate was the lowest recorded from 1960 through 2000. In 2001, the juvenile property crime arrest rate fell to 1451, and fell to 1395 in 2002, 17 years after average preschool blood lead fell to 5.1 mcg/dl in 1985. National blood lead survey data collected from 1988-1991 found that average preschool blood lead had fallen to 2.8 mcg/dl but 33% of preschool children still had blood lead above 5 mcg/dl. The percent of USA children under age 6 with blood lead over 5 mcg/dl fell to 9.9% in 1999-2000 and to 0.5% in 2013-2014.
For 60 years, the juvenile property crime arrest rate has tracked the rise and fall of average preschool blood lead and it is still tracking the fall in preschool blood lead prevalence above 5 mcg/dl. In 2019, the juvenile property crime arrest rate was just 359 per 100,000 population ages 10-17, less than 25% of the 1960 rate.
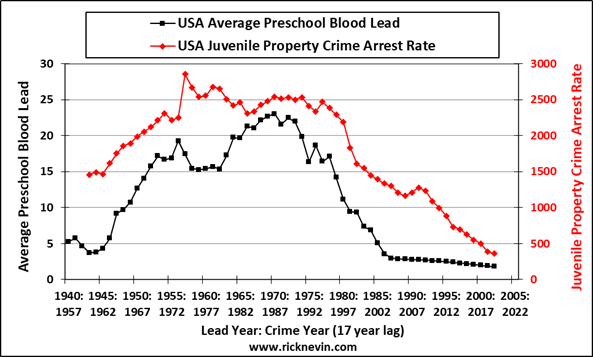
Sources: Blood lead: Nevin (2007); Juvenile Arrest Rates: FBI arrest rates reported by Youthfacts and OJJDP