A crime surge without robbers, burglars, or thieves
“Cable newscasters, criminologists, and city officials have repeatedly warned Americans of rising crime nationwide. But the “crime is up” narrative doesn’t tell the full story, experts say.” (The Crime Report, July 16, 2021)
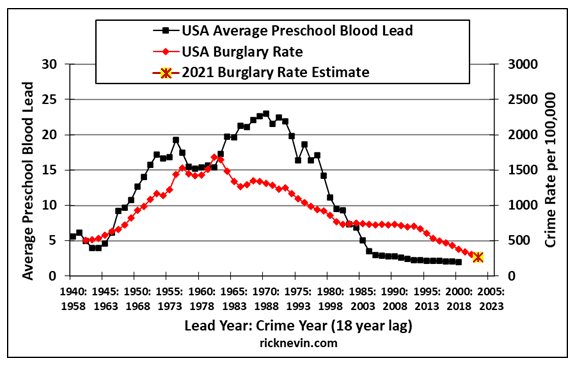
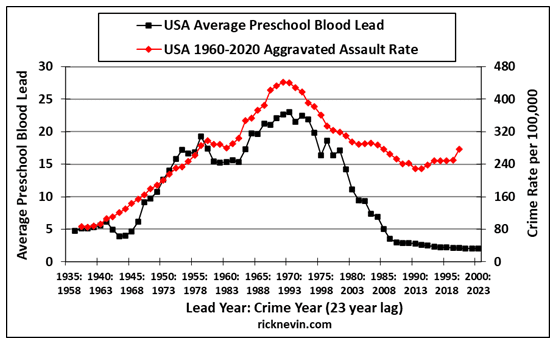
In fact, some cable newscasters insist that the USA is experiencing a massive crime surge, even as robbery, burglary, and felony larceny-theft rates fell to multi-decade lows in 2020 and are still falling in 2021. Crime trends continue to track earlier trends in preschool lead exposure. Juveniles and young adults have recorded the largest arrest rate declines due to birth year trends in lead exposure. Burglary and robbery rates have also tracked earlier preschool lead exposure trends in Canada, Britain, and Australia.
In 2015, the USA burglary rate fell to the lowest level ever recorded in data that goes back to 1960. The burglary rate then fell to new record lows in 2016, 2017, 2018, and 2019. FBI preliminary data show another 8.5% drop in burglaries in 2020. YTD 2021 data from more than 65 cities and large counties (see table at end of post) suggest that the burglary rate is likely to fall another 15% in 2021. That would take the burglary rate in 2021 down to about one half of what it was in 1960.
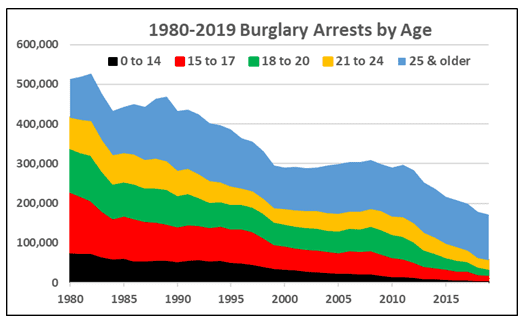
Adults ages 25 and older accounted for just 19% of all burglary arrests in 1980 but they accounted for 67% of burglary arrests in 2019. FBI data on 2020 arrests by age won’t be available until later this year, but crime data reported by Florida and California show juvenile burglary arrests fell in 2020 by 13.6% in Florida and by 24.3% in California.
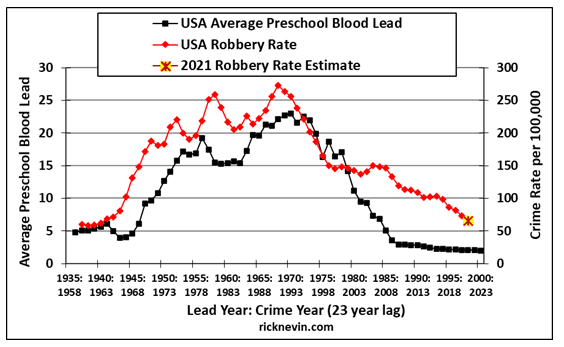
In 2019, the robbery rate fell to the lowest level since 1966. FBI preliminary data show that robberies fell another 10.7% in 2020. YTD 2021 data show the robbery rate is likely to fall another 10% in 2021, to the lowest level since 1964.
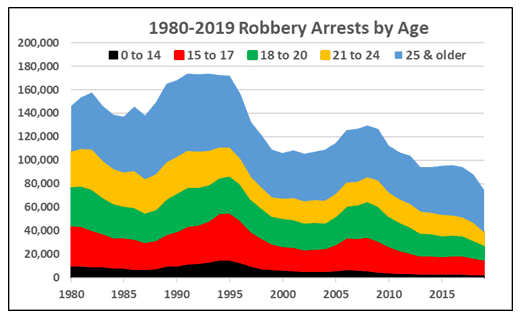
Adults ages 25 and older accounted for 27% of robbery arrests in 1980 but they accounted for 48% of robbery arrests in 2019. In 2020, juvenile robbery arrests fell another 19.2% in Florida and 33.3% in California.
In 2019, the felony larceny-theft rate fell to the lowest level since 1966. FBI preliminary data show that larceny-thefts fell another 10.6% in 2020. YTD 2021 data show the felony larceny-theft rate is likely to fall another 5% in 2021, to the lowest level since 1964.
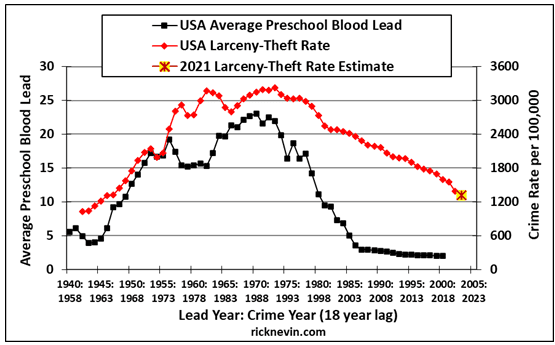
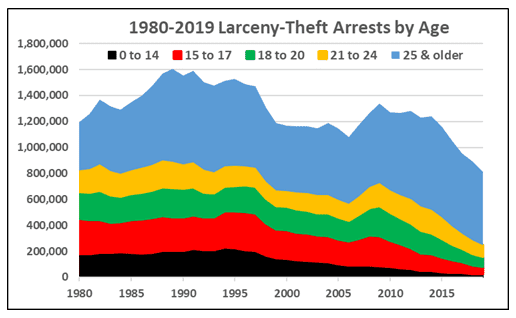
Adults ages 25 and older accounted for 31% of larceny-theft arrests in 1980 but they accounted for 70% of larceny-theft arrests in 2019. In 2020, juvenile larceny-theft arrests fell another 31.1% in Florida and 30.9% in California.
FBI preliminary data do show that motor vehicle thefts increased by 10.1% in 2020. The vehicle theft rate has fluctuated in a fairly narrow range since 2010, at levels lower than any year since 1963. The increase in 2020 did not change that pattern. It just raised the vehicle theft rate back to about where it was in 2017.
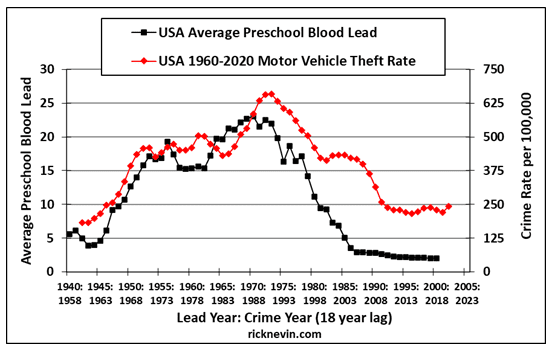
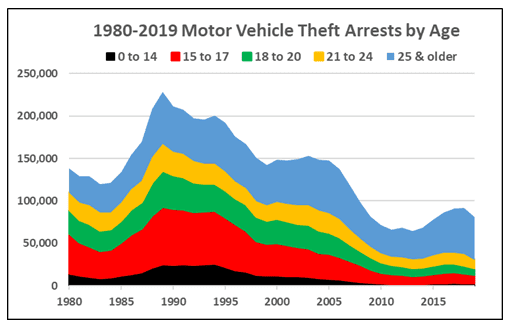
Adults ages 25 and older accounted for 20% of motor vehicle theft arrests in 1980 but they accounted for 62% of vehicle theft arrests in 2019. In 2020, juvenile motor vehicle theft arrests fell another 9.4% in Florida and 22.3% in California.
FBI preliminary data also show that aggravated assaults increased 10.5% in 2020, after little change from 2010-2019. The 2020 increase was significant but the aggravated assault rate in 2020 was still lower than in any year from 1979 through 2008.
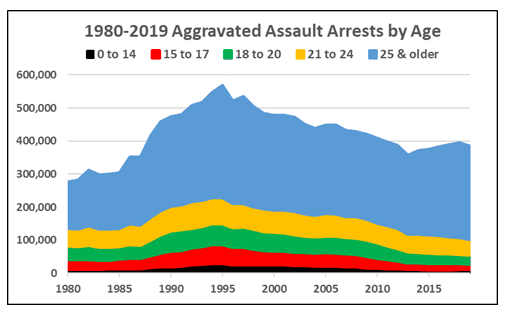
Adults ages 25 and older accounted for 51% of aggravated assault arrests in 1980 but they accounted for 74% of aggravated assault arrests in 2019. In 2020, juvenile aggravated assault arrests fell 18.5% in Florida and 35.2% in California.
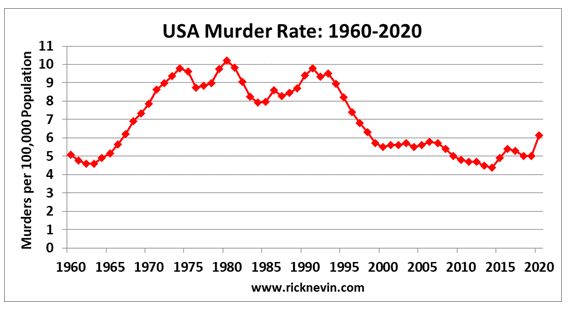
The award for most honest and accurate headline about recent crime trends goes to German Lopez at Vox: “Murders are up. Crime is not. What’s going on?“. The USA murder rate in 2019 was lower than it was in 1960, but FBI preliminary data show that murders rose by 23% in 2020. The Lopez story included a graph showing the number of murders in each year from 1960-2020, but a fairer comparison across decades is murders per capita. By that measure, the 2020 murder rate spike was awful, but the murder rate in 2020 was still lower than in any year from 1967-1998.
There is no consensus about what caused the 2020 spike in murders. The pandemic impact on narcotic drug use was almost certainly a factor. FBI data on murders by circumstance report 591 murders in 2019 were associated with narcotic drug felonies – more than any other felony crime. The CDC reports that drug overdose deaths rose 29.4% in 2020. Murders associated with narcotic drug felonies might have increased proportionately.
The circumstance associated with most murders is not another felony. In 2019, there were 88 murders associated with domestic violence, 75 associated with brawls influenced by alcohol or narcotics, 128 associated with arguments over money or property, and 3,410 murders associated with “other arguments”.
Other stupid arguments. The pandemic stress impact on other stupid arguments could explain most of the 2020 spike in murders and most of the increase in aggravated assaults.
2021 YTD % Change in Robbery, Burglary, and Felony Larceny-Theft
| City/County State | Robbery | Burglary | Larceny-Theft | 2021 YTD |
| New York City NY | 0% | -24% | 1% | 25-Jul |
| Houston TX | -8% | -6% | -8% | 30-Jun |
| Los Angeles CA | -4% | -16% | -10% | 17-Jul |
| Chicago IL | -5% | -39% | 6% | 25-Jul |
| L.A. County CA | -24% | -20% | -2% | 30-Jun |
| Philadelphia PA | -9% | -36% | -4% | 25-Jul |
| Dallas TX | -26% | -22% | 3% | 26-Jul |
| Baltimore MD | -33% | -39% | -26% | 17-Jul |
| San Francisco CA | -12% | 2% | -3% | 25-Jul |
| Oakland CA | 14% | -39% | -19% | 25-Jul |
| San Antonio TX | -31% | -19% | -5% | 30-Jun |
| Memphis TN | -24% | -29% | -16% | 31-Mar |
| Detroit MI | -26% | -28% | -21% | 24-Jun |
| Las Vegas NV | -27% | 9% | 8% | 23-Jul |
| Nashville TN | -18% | -10% | -14% | 24-Jul |
| Charlotte-Meck NC | -22% | -23% | 5% | 30-Jun |
| Minneapolis MN | 16% | -36% | -4% | 27-Jul |
| Seattle WA | 15% | 0% | 8% | 30-Jun |
| Kansas City MO | -32% | -24% | 1% | 30-Apr |
| St. Louis MO | -33% | -38% | -2% | 27-Jun |
| San Diego CA | -17% | 2% | 2% | 30-Apr |
| Washington DC | 3% | -15% | -3% | 25-Jul |
| Atlanta GA | -3% | -39% | 17% | 24-Jul |
| Forth Worth TX | -28% | 3% | -13% | 30-Jun |
| New Orleans LA | 19% | -35% | -9% | 21-Jul |
| Louisville KY | 6% | -11% | -8% | 24-Jul |
| Miami-Dade County FL | -35% | -38% | -17% | 18-Jul |
| San Jose CA | -3% | 3% | -14% | 30-Jun |
| Austin TX | -12% | 6% | -10% | 30-Jun |
| Boston MA | -24% | -31% | -15% | 25-Jul |
| Aurora CO | 13% | 16% | 10% | 30-Jun |
| Sacramento CA | -5% | -14% | -8% | 11-Jun |
| Oklahoma City OK | -30% | 34% | -12% | 31-May |
| Portland OR | 6% | -13% | -4% | 30-Jun |
| Cincinnati OH | -29% | -32% | -8% | 24-Jul |
| San Bernardino CA | -27% | -21% | 6% | 31-May |
| Long Beach CA | -9% | -13% | 7% | 30-Jun |
| Tulsa OK | -2% | -16% | 0% | 31-Mar |
| Buffalo NY | -13% | -16% | -5% | 30-Jun |
| Durham NC | -14% | -30% | -10% | 26-Jun |
| Greensboro NC | -15% | -15% | -3% | 25-Jul |
| Corpus Christi TX | -6% | -17% | 5% | 30-Jun |
| Omaha NE | -14% | 5% | 1% | 30-Jun |
| Salt Lake City UT | -1% | 18% | 6% | 25-Jul |
| Lubbock TX | -10% | -5% | -11% | 30-Jun |
| Little Rock AR | -10% | 14% | 2% | 26-Jul |
| Newark NJ | -8% | -15% | -30% | 25-Jul |
| Arlington TX | -35% | -7% | -5% | 30-Jun |
| Lexington KY | -21% | -18% | 10% | 30-Jun |
| Spokane WA | -7% | -18% | -13% | 18-Jul |
| Garland TX | -34% | -16% | 3% | 30-Jun |
| Beaumont TX | -17% | 25% | -16% | 30-Jun |
| Flint MI | -40% | -33% | -23% | 25-Jul |
| Irving TX | -21% | -45% | -25% | 30-Jun |
| Shreveport LA | 8% | -18% | -20% | 31-May |
| Winston Salem NC | -30% | -14% | -15% | 31-May |
| Richmond VA | 8% | -29% | -13% | 25-Jul |
| Syracuse NY | 46% | -24% | -24% | 26-Jul |
| Lincoln NE | -23% | -17% | -13% | 4-Jul |
| Providence RI | -13% | -34% | -8% | 25-Jul |
| Antioch CA | -52% | -47% | -39% | 31-May |
| Waco TX | -2% | -21% | -29% | 30-Jun |
| Pasadena CA | -14% | -12% | -11% | 30-Jun |
| Cedar Rapids IA | -31% | -42% | -13% | 30-Jun |
| Fort Wayne IN | -43% | -33% | -4% | 30-Jun |